Crew members at The Country Club at Muirfield Village in Dublin, Ohio, follow a system created by assistant superintendent Joseph Sims that helps them set goals, communicate clearly and value each other's work. Photos courtesy of Joseph Sims
Soil testing is an important tool for golf course superintendents but deciding on how to interpret the soil test results is not always straightforward. Different laboratories may provide different fertilizer recommendations from the same soil sample, leaving us wondering: Are we applying too much fertilizer? Too little? Which recommendation should we trust?
Two of the commonly used approaches for interpreting soil test results are the Sufficiency Level of Available Nutrients (SLAN) and Minimum Levels for Sustainable Nutrition (MLSN). For decades, SLAN has been the standard approach for interpreting soil test results in turfgrass management. Its goal is to achieve maximum turfgrass growth with the minimum amount of fertilizer (5). Meanwhile, MLSN considers the minimum soil nutrient levels required to sustain high turfgrass quality, instead of maximizing turfgrass growth (8). One advantage of this approach is to potentially reduce phosphorus (P) and potassium (K) inputs without sacrificing turfgrass quality (8).
Another key difference between these approaches is how they were developed and how broadly they can be applied. The SLAN approach is based on studies conducted under specific growing conditions, so it can be difficult to know how those recommendations translate to other locations. The MLSN approach, on the other hand, was developed using data from well-performing turfgrass across various locations and was designed to be applied under different growing conditions (8). However, despite the growing interest in MLSN, relatively few studies have evaluated how well it performs under different climatic conditions and soil types.
This begs the question: Can MLSN perform as well as the regionally developed SLAN that superintendents have relied on for years? Can it reduce fertilizer input without sacrificing turfgrass quality?
To answer these questions, we compared the MLSN and SLAN recommendations for P and K on a creeping bentgrass green in Michigan. We also evaluated turfgrass quality under trafficked and non-trafficked conditions to see if lower inputs associated with MLSN could provide turfgrass quality similar to SLAN.
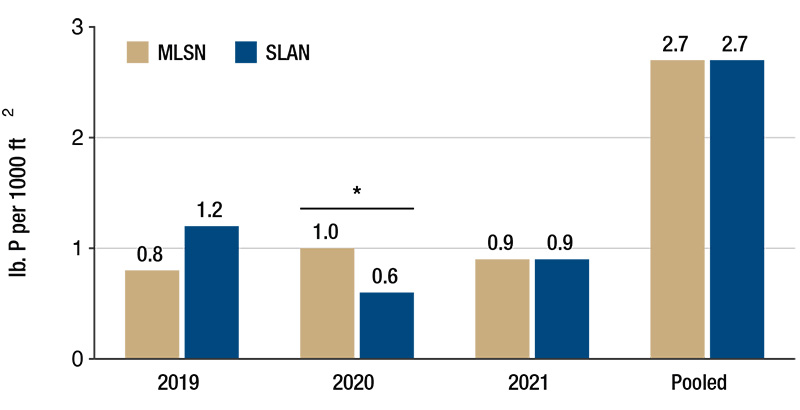
Figure 1. Recommended phosphorus (P) application rate based on two approaches to soil testing interpretation on Penn A-4 creeping bentgrass grown on a USGA-specification putting green in East Lansing, Mich., from 2019 to 2021. Within each year, an asterisk indicates statistical significance according to Fisher’s protected LSD test (p ≤ 0.05).
Comparing SLAN and MLSN on a creeping bentgrass green
Study site and experimental design
Our study was conducted at the Hancock Turfgrass Research Center at Michigan State University (MSU) from 2019 to 2021. This study was performed on a Penn A-4 creeping bentgrass green that was built according to 2006 USGA specifications and was maintained at 0.125-inch mowing height. Experimental units were arranged in a split-plot design. The soil test interpretation treatments were SLAN, MLSN and a nitrogen-fertilized control. All treatments received 1.5 pounds nitrogen per 1,000 square feet (73.24 kilograms per hectare) every growing season. P and K recommendations for the SLAN and MLSN treatments were based on their respective guidelines. Each soil test interpretation plot was divided into two subplots: half received simulated traffic (~474 rounds of golf traffic per week) while the other half received no traffic. Turfgrass quality was rated visually every month with 1 = poorest, 9 = best, and a rating of ≥6 considered acceptable.
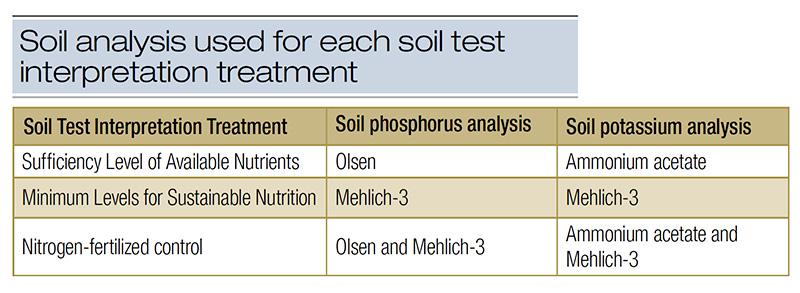
Table 1. Soil analysis used for each soil test interpretation treatment
Soil sampling, analysis and interpretation
Soil samples were collected at the beginning and end of each growing season. Each 1-inch (2.54-centimeter) soil core was collected at 6-inch (15.24-centimeter) depth and verdure was removed. In May 2019, five cores were randomly collected across the research area. Beginning in November 2019, five cores were randomly collected from each plot. These cores were combined to form a composite sample, which was submitted to MSU Soil and Plant Nutrient Laboratory for analysis (Table 1).
Soil test results were interpreted into fertilizer recommendations. SLAN recommendations were based on the equations provided by the MSU Soil Plant and Nutrient Laboratory for established golf course putting greens. MLSN recommendations were calculated using the formula described by Woods et al (8). Detailed formulas are available in our full research article (https://doi.org/10.1002/cft2.70100).
Nutrient application rates>
Over the three-year study, both approaches recommended similar cumulative amounts of P (Figure 1). However, year-to-year differences were observed. In 2019, the SLAN approach recommended 50% more P application than the MLSN approach. This trend reversed in 2020, when the MLSN approach recommended a 60% more P than the SLAN approach. By 2021, both approaches recommended the same P application rate. In contrast, the SLAN approach consistently recommended a higher K application rate than the MLSN approach from 2019 to 2021 (Figure 2). As a result, the cumulative recommendation based on the SLAN approach was 200% greater that MLSN approach over the three-year study period.
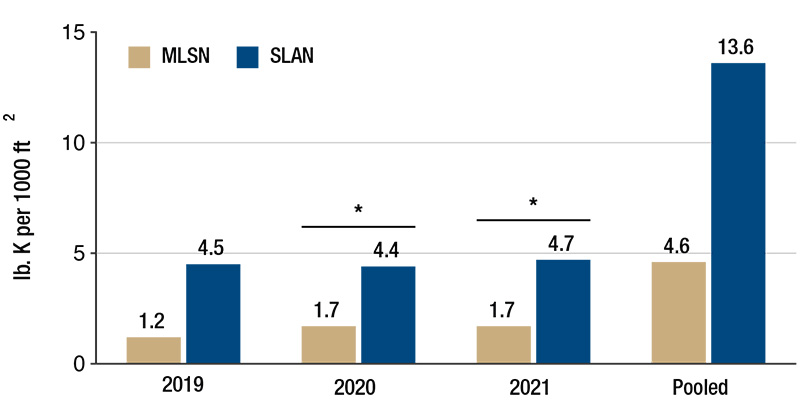
Figure 2. Recommended potassium (K) application rate based on two approaches to soil testing interpretation on Penn A-4 creeping bentgrass grown on a USGA-specification putting green in East Lansing, Mich., from 2019 to 2021. Within each year, an asterisk indicates statistical significance according to Fisher’s protected LSD test (p ≤ 0.05).
Soil nutrient levels and turfgrass quality
Soil P levels increased over the course of the study, showing that applied P applications stayed in the soil and built up over time — which was also found in previous research (2, 6). This build up is important because it suggests that P does not need to be applied frequently. Once applied, much of the P remains in the soil and continues to be used up by the turfgrass.
So, what soil P level is enough? In this study, after three years of treatment application, the Mehlich-3 P levels average was 6 ppm for MLSN plots while 13 ppm in the SLAN plots. Despite these differences, turfgrass quality remained acceptable for both treatments and showed no signs of P deficiency (Figure 3). Similar results have been reported in previous research, which found that acceptable creeping bentgrass quality could be achieved within the Mehlich-3 P range of 6 to 11 ppm (3).
Soil K levels also increased throughout the study. However, despite receiving 200% K, the SLAN plots did not have a proportionally higher soil K levels than the MLSN plots. This was likely due to limited cation exchange capacity of sandy soils to retain K (7). A key takeaway from this study was that both SLAN and MLSN performed similarly under non-trafficked and trafficked conditions. K application is often associated with improved stress tolerance. Because the SLAN approach recommended higher K rates, we expected those plots to maintain better turfgrass quality under traffic stress than the MLSN plots. However, that was not the case, proving that additional K does not necessarily improve traffic tolerance for creeping bentgrass (1, 4).
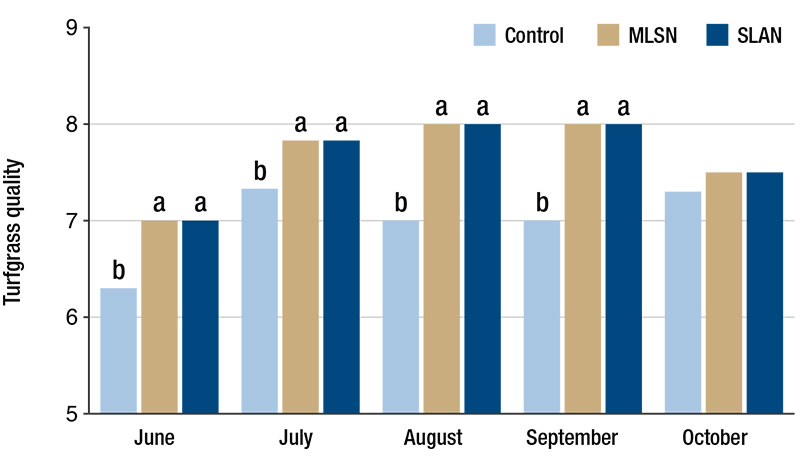
Figure 3. Effect of soil testing interpretation: Minimum Levels for Sustainable Nutrition (MLSN) and Sufficiency Level of Available Nutrients (SLAN) on the turfgrass quality of Penn A-4 creeping bentgrass grown on a USGA-specification putting green in East Lansing, Mich., in 2021. Turfgrass quality was rated visually with 1 = poorest, 9 = best, and a rating of ≥6 considered acceptable. Within months, means followed by the same letter are not significantly different according to Fisher’s protected LSD (p ≤ 0.05).
Recommendation based on the MLSN approach maintained acceptable turfgrass quality while recommending similar P rate but lower K rate than SLAN. The results also raise several important questions about K management: Are we applying more K than needed on sandy putting greens? Should we adjust the K recommendations in Michigan? Should we apply K more like N, using smaller, more frequent applications? Future research is needed to determine the most effective K management for USGA putting greens.
The research says
- Recommendation based on the MLSN approach maintained acceptable turfgrass quality while recommending similar P rate but lower K rate than SLAN.
- The results also raise several important questions about K management: Are we applying more K than needed on sandy putting greens? Should we adjust the K recommendations in Michigan? Should we apply K more like N, using smaller, more frequent applications?
- Future research is needed to determine the most effective K management for USGA putting greens.
Literature cited
- Carroll, M.J., and A.M. Petrovic. 1991. Wear tolerance of Kentucky bluegrass and creeping bentgrass following nitrogen and potassium application. HortScience 26(7):851-853 (https://doi.org/10.21273/HORTSCI.26.7.851).
- Guertal, E.A. 2006. Phosphorus movement and uptake in bermudagrass putting greens. USGA Turfgrass and Environmental Research Online 5(12):1-7 (https://usgatero.msu.edu/v05/n12.pdf).
- Kreuser, W.C., P.H. Pagliari and D.J. Soldat. 2012. Creeping bentgrass putting green Mehlich-3 soil test phosphorus requirements. Crop Science 52(3):1385-1392 (http://doi.org/10.2135/cropsci2011.08.0416).
- Mirmow, W.N. 2016. Fall potassium fertilization and winter traffic effects on a creeping bentgrass putting green. [Master’s thesis, Clemson University]. All Theses. 2452 (https://open.clemson.edu/all_theses/2452).
- Mitscherlich, E.A. 1909. Das Gesetz des Minimums und das Gesetzdes abnehmenden Bodenertrags. Landwirtschaftliche Jahrbücher 38:537-552.
- Soldat, D.J. and A.M. Petrovic. 2008. The fate and transport of phosphorus in turfgrass ecosystems. Crop Science 48(6):2051-2065 (https://doi.org/10.2135/cropsci2008.03.0134).
- Spencer, W.F. 1954. Influence of cation-exchange reactions on retention and availability of cations in sandy soils. Soil Science 77(2):129-136 (https://doi.org/10.1097/00010694-195402000-00005).
- Woods, M. S., L.J. Stowell and W.D. Gelernter. 2016. Minimum soil nutrient guidelines for turfgrass developed from Mehlich 3 soil test results (https://doi.org/10.7287/peerj.preprints.2144v1).
Acknowledgements
The authors would like to thank Dr. Paul Rieke, Dr. James B. Beard, Harriet Beard, and the Michigan Turfgrass Foundation for their generous financial support of this research.
Jackie Lyn A. Guevara, Ph.D., (guevar13@msu.edu) is an assistant professor, Payton C. Perkinson is a graduate student and Kevin W. Frank, Ph.D., is a professor and Turf Extension Specialist, all in the Department of Plant, Soil and Microbial Sciences, Michigan State University, East Lansing.