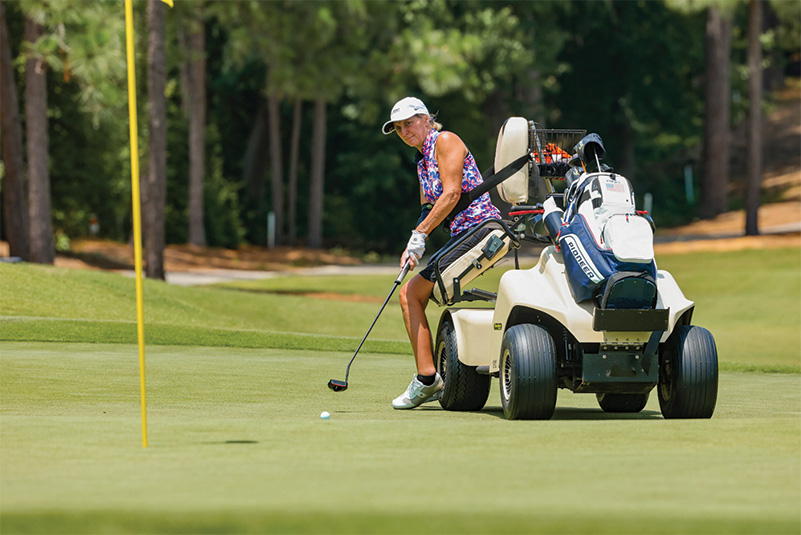
Some adaptive golfers require the use of a single-rider seated golf cart while playing, which includes driving on the putting green. We wanted to better understand whether this traffic has any impact on putting green smoothness and trueness. Pictured is Annie Hayes, winner of the women's seated player category at the 2024 U.S. Adaptive Open. Photos courtesy of the USGA
Editor’s note: This article is reprinted with permission from the Oct. 18, 2024, issue of the USGA Green Section Record. Copyright USGA. All rights reserved. The original article can be accessed at: https://bit.ly/4hR7Gku.
Golf is a game for everyone, including people with disabilities. In recognition of this fact, the United States Golf Association debuted the U.S. Adaptive Open in 2022. Whether a course is hosting a national championship for adaptive golfers or simply trying to improve access and enjoyment for normal play, questions arise about how to best accommodate adaptive players and whether there are any unique course maintenance considerations involved.
A common area of uncertainty among golf course operators is how to manage seated golf cart access onto putting greens. A key focus is having players with disabilities feel welcome and included, but many decision-makers at golf facilities have also expressed concern over potential surface disruption that may be caused by a seated golf cart driving on a green, especially following rainfall. There is a lack of data on the effects of single-rider seated carts on putting greens, and the few studies conducted have been in a lab setting or with mobility devices that are no longer used in golf (1, 2).
It would be beneficial for the adaptive golf community and all the courses eager to host adaptive players to determine what, if any, impact seated carts have on putting greens and to develop guidelines regarding their use during adaptive golf events or routine play. To better understand the impact of modern seated carts on putting surfaces, the USGA Green Section initiated two field studies in July 2024 at the Third U.S. Adaptive Open, held at Sand Creek Station Golf Course in Newton, Kan.
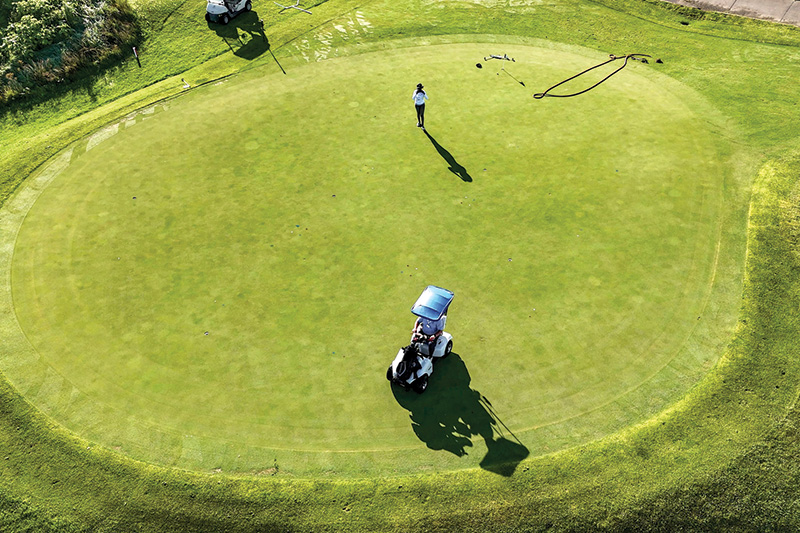
An overview of the research plots on a practice green at Sand Creek Station Golf Course as traffic is applied with a SoloRider seated golf cart.
Field Study 1: Assessing the impact of two types of seated carts on putting green smoothness and trueness at three volumetric water content levels
Materials and methods
An experiment was established on a mixed L-93 and Southshore creeping bentgrass practice green at Sand Creek Station during advance week prior to the championship. The practice green was constructed with a 12-inch sand-based root zone over subsurface drainage, maintained in good condition and was single cut at 0.125 inch (3.175 millimeters) daily. No rainfall occurred during the field study, and irrigation was applied as needed overnight.
A split-plot treatment structure was used in a randomized complete block design to evaluate the combined effects of different single-rider carts (whole plots) and three soil-moisture levels (subplots) on putting green smoothness and trueness. An untreated control and two types of single-rider seated carts were assessed: SoloRider (Adaptive Devices LLC, Plano, Texas) and ParaMotion (PowerBaseTec GmbH, Germany). Carts similar to the design of the ParaMotion are commonly referred to as “para-type” carts and have a rear wheel assembly capable of pivoting sharply, allowing for greater maneuverability. Specifications, including weight and tire information for both carts, can be found in Appendix A. The operator, golf clubs and accessories added an additional 260 pounds to the overall weight of each cart. Immediately prior to the application of traffic treatments, individual plots were hand-watered to achieve three different volumetric water content (VWC) levels, plus or minus 2% of targets: 15% VWC (normal), 25% (wet) and 35% (very wet) as measured with a FieldScout TDR 350 Soil Moisture Meter (Spectrum Technologies, Aurora, Ill.) equipped with 3-inch (7.62-centimeter) rods. One-foot (30.5-centimeter) alleyways separated individual plots to limit lateral flow and maintain soil-moisture treatments. Because of space limitations, three sets of soil-moisture treatments (nine total plots) were established and maintained over three days. The traffic treatments (untreated, SoloRider and ParaMotion) were then each applied as a single pass across the center of a set of three plots, containing each soil-moisture level, over the three days to achieve three replications of the experiment. Traffic treatments were re-randomized each day.
Data collection
The GS3 smart ball was used to measure surface smoothness and trueness before and after traffic treatments. The ball calculates these metrics with internal sensors that measure the number and magnitude of deviations from what should be a true and smooth roll (beyond a threshold that accounts for background noise) and running that data through sophisticated algorithms. Both metrics are measured in values starting at 0 (perfectly smooth and true) and increasing as the surface becomes less smooth and true. Over tens of thousands of roll tests with the GS3, data shows the average putting green smoothness value to be 3.85 and average trueness value to be 0.73 across all assessed golf courses. Several previous experiments with the GS3, including at the U.S. Open, have demonstrated its ability to detect the impact of foot and equipment traffic on a putting green. In this study, the GS3 was rolled off a standard USGA Stimpmeter from the 1X notch, and measurements were recorded digitally.
Data collection took place at 0 minutes (prior to traffic application), 45 minutes, 90 minutes and 135 minutes after traffic was applied. Individual plots measuring 12 feet by 12 feet (3.66 meters by 3.66 meters) were established to accommodate rolling the GS3 eight times across each individual plot in four directions at each data collection interval. Two rolls were made diagonally, in both directions, from all four corners of the plot to ensure it crossed the same area as the cart tires. A minimum of 216 individual rolls were made over all plots during each replication to mitigate the effect of any natural variability in the putting surface. If an anomalous roll occurred — i.e., the GS3 clearly hit a surface imperfection not part of the traffic treatments — the roll was deleted and redone. The count of anomalous rolls was 10 or less per replication.
Putting green firmness was also assessed with the GS3 at each of the four data collection time points, and additional VWC readings were collected to monitor the “dry down” of the root zone from initial moisture levels. All data were collected in the field on the USGA’s DEACON mobile app and stored for future analysis and presentation.
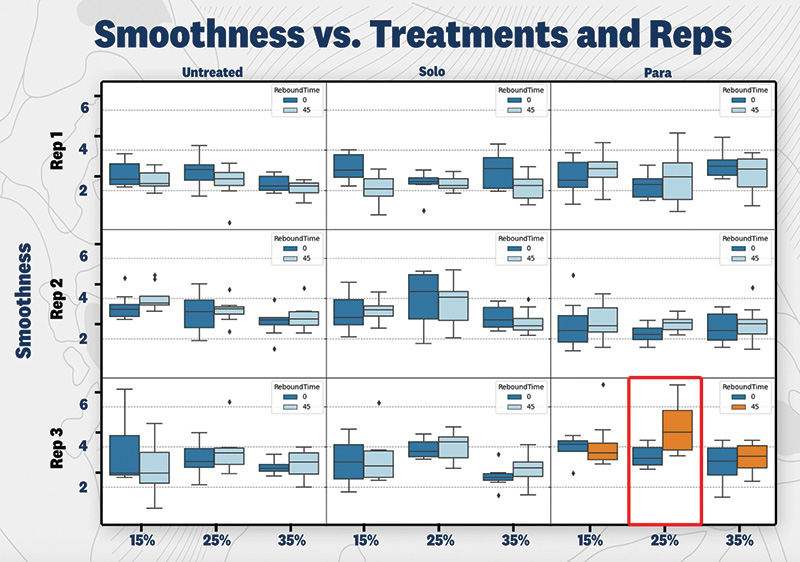
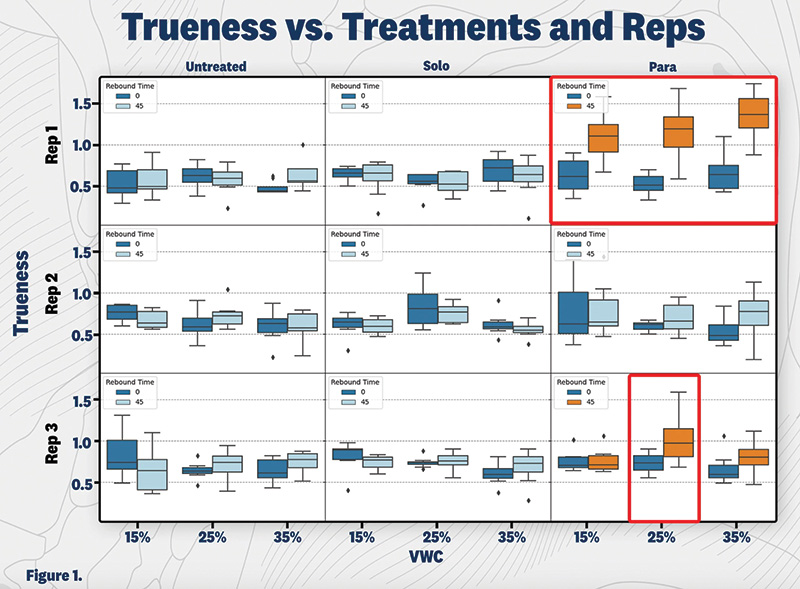
Figure 1. This figure shows putting green smoothness (top panel) and trueness (bottom panel) measurements prior to (dark blue boxes) and 45 minutes after (light blue boxes) traffic was applied with a SoloRider cart (Solo) and ParaMotion cart (Para), plus an untreated control, to plots with three different volumetric water content levels (15%, 25% and 35%). The only significant differences detected were with the ParaMotion, with three plots decreasing in trueness and one plot decreasing in both smoothness and trueness 45 minutes after traffic was applied (outlined in red). However, these effects were minor and dissipated by 90 minutes after traffic application. Smoothness and trueness metrics were evaluated using the GS3 smart ball across three replications in time.
Preliminary results
Paired-samples t-tests were conducted for all plots within each replication. Initial tests were conducted to check for statistical differences in average smoothness and trueness between 0-minute and 45-minute time points in each replication. Additionally, we verified that any statistical differences were larger than the inherent measurement-to-measurement variability of GS3 roll metrics. If a statistical difference in excess of the expected variability of a GS3 metric was detected on a plot, we then repeated t-tests across each time interval within that plot to assess whether smoothness and trueness returned to pre-traffic levels.
Initial indications from the data are that the traffic treatment effects are not significant when averaged over replications; however, we wanted to evaluate effects within each day (replication) as an early step in the data analysis (Figure 1). For the SoloRider, across all replications and moisture levels, we observed no loss in surface smoothness or trueness at 45, 90 or 135 minutes after traffic was applied. For the ParaMotion, the data shows a possible relationship between cart traffic and loss of smoothness and trueness as shown in Figure 1. However, this observation was not consistent across all replications. Furthermore, when ParaMotion traffic reduced smoothness or trueness, the magnitude of the effect was small and was unapparent between 45 and 90 minutes after traffic was applied. There may be some cases where para-type carts affect roll-quality metrics, but even when this does happen, the effect is temporary. The SoloRider cart had no effect on smoothness or trueness in this study.
The two rear pneumatic tires of para-type carts are on a caster-type assembly that allow it to be more maneuverable than the SoloRider, with a turning radius of 3 feet (0.91 meter) compared to 6 feet (1.83 meters). However, the narrower rear tires and sharper turning radius make it more prone to disrupting the surface, and extra care and training may be required so operators avoid turning too sharply while on the green.
Although the ParaMotion cart did impact surface smoothness and trueness in a few cases, it’s worth emphasizing that those impacts were no longer detected at 90 minutes and beyond. Three of the four plots that showed a significant decrease in trueness and/or smoothness were in the first replication, with the mean trueness value increasing (surface became less true) from between 0.5 and 0.7 to between 1.1 and 1.4 in those plots at 45 minutes after traffic was applied (Figure 2). However, by 90 minutes after ParaMotion traffic, all three mean trueness values returned to pre-traffic levels and remained there. The same held true for one additional plot (third replication, 25% VWC) which had an increase in both trueness and smoothness values (became less smooth and true) at 45 minutes after ParaMotion traffic but returned to pre-traffic levels at 90 minutes. Overall, 14 of the 18 individual traffic treatment plots, across all VWC levels, were unaffected by seated cart traffic, and no significant differences were detected at any data collection time point on the untreated plots.
Another notable result was the “dry-down” effect between data collection intervals. Across all replications and plots, the “very wet” VWC treatment of 35% reduced to 27% or lower after 135 minutes. This demonstrates the efficiency of sand-based greens with internal drainage at removing excess water from the root zone. Unfortunately, a common occurrence reported by those in the adaptive golf community is for putting greens to tolerate seated-cart traffic after rain, yet the fairways or other areas of the course are inaccessible. Therefore, it’s important for courses to evaluate the condition of all playing surfaces before allowing any type of golf cart on the course.
It’s important to acknowledge that the test conditions in this field study did not account for turning, tire pressure or the duration that a cart might be in one place, i.e., while putting. Additionally, the greens at Sand Creek Station are well maintained, whereas putting greens with excessive thatch, drought stress or other agronomic issues would likely not receive this traffic well.
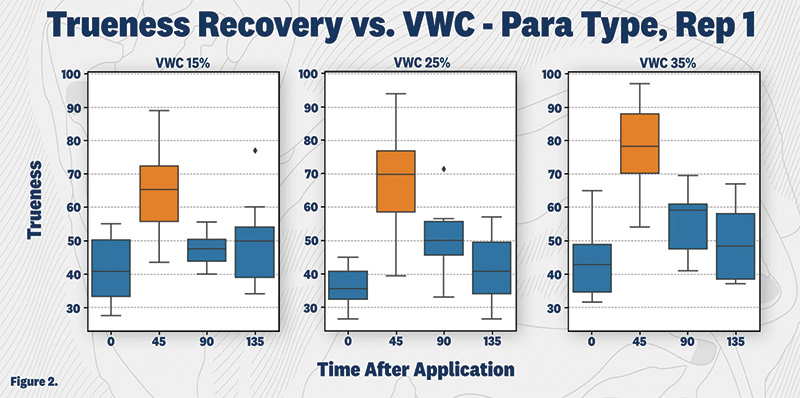
Figure 2. An initial increase in the trueness value (putting surface became less true) was measured at 45 minutes after traffic from a ParaMotion seated cart. However, these three plots returned to pre-traffic levels of smoothness at 90 and 135 minutes after traffic. Only one additional plot across all other replications showed a difference in trueness or smoothness at 45 minutes, and it also returned to the pre-traffic level after 90 minutes.
Field Study 2: The effect of traffic from multiple seated carts on putting green smoothness
Materials and methods
For courses hosting an adaptive golf event, it would be useful to know the potential impact from not just one seated cart, but multiple seated carts of different styles over the same day. USGA staff at the 2024 U.S. Adaptive Open identified three putting greens where — due to bunkers, mounds and the location of the next teeing area — all seated carts were exiting the putting green in the same small area. Therefore, a field study to investigate the effects on putting green smoothness from concentrated traffic from multiple single-rider seated carts was initiated. The three greens identified with concentrated traffic were considered replications for the experiment — all were built and maintained in the same manner as the practice green in Field Study 1. During the study period, five seated players competed using three SoloRider Carts, one VertaCat (para-type cart) and one ParaGolfer (para-type cart). Study areas 25 feet (7.62 meters) long were centered on the previously identified exit points and marked on each of the three greens.
Data collection
As in Field Study 1, the GS3 was used to collect smoothness, trueness and firmness measurements twice, once after mowing but prior to seated-cart traffic, and again following the completion of play. USGA staff marked where each seated cart passed within the designated test area, and the GS3 roll tests were performed to cover the entire area using eight roll tests in two directions, with each roll passing over at least three sets of tracks. Pre-traffic data collection took place from 9 a.m. to 9:30 a.m., and post-traffic data collection from 1 p.m. to 1:30 p.m. The roll test on each of the three greens took place approximately 150 minutes after the ParaGolfer cart, 120 minutes after two SoloRiders, 90 minutes after the VertaCat and 15 minutes after the third SoloRider. The only exception to the amount of traffic on each green was one SoloRider player exiting the fourth green outside of the test area. Average VWC across all three greens was 19.2% at the start of play, with a range of 18.1% to 21.9%.
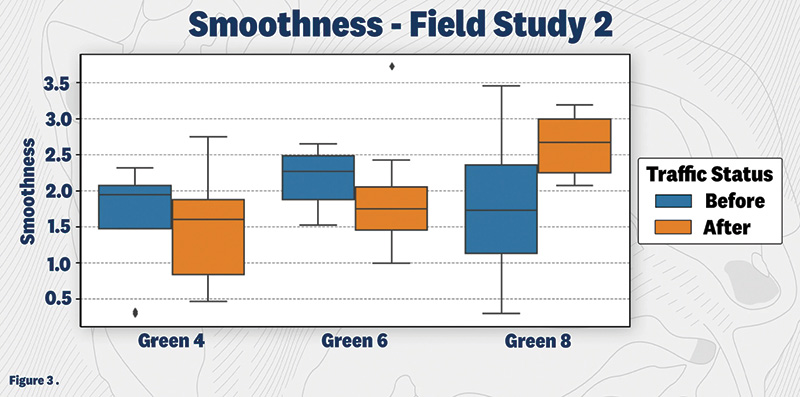
Figure 3. The average smoothness of three putting greens before and after traffic was applied by five different seated carts over five hours on July 10, 2024. Two greens showed no impact from the cart traffic while one green showed a minor impact.
Preliminary results
We again used paired-samples t-tests to evaluate whether cart traffic produced a statistically significant difference in average smoothness, using each green as its own control (i.e., smoothness after mowing, but before traffic). As shown in Figure 3, we saw no statistically significant difference in average smoothness on Greens 4 and 6, and a weak relationship between average smoothness and cart traffic on Green 8 (p=0.0493). In terms of practical significance, the difference in average smoothness before and after traffic on Green 8 was 0.85 points. Based on a recent Gage Repeatability & Reproducibility study for GS3 roll metrics, we understand the precision of smoothness estimates of a single roll test to be plus or minus approximately 1.0 point. So, we would conclude that the relationship identified on Green 8 is statistically significant but likely not practically different.
Additionally, four of the five carts passed through the test area within 120 minutes of the post-traffic data collection time point. The two para-type carts passed through the test areas about 150 and 90 minutes prior to the second data collection time point, and the final SoloRider cart passed 15 minutes prior. This is consistent with Field Study 1, where the effect from the para-type cart was no longer detected 90 minutes after traffic, and no effect from the SoloRider was detected at any time point. Overall, initial results indicate that multiple seated golf carts driving across the same green on the same day do not cause a reduction in surface smoothness, to the extent that the GS3 is capable of detecting. Data analysis of both studies is ongoing, and additional work, including treatment means over actual replication, may be needed to ensure any variability detected in the results isn’t misattributed to treatment effects.
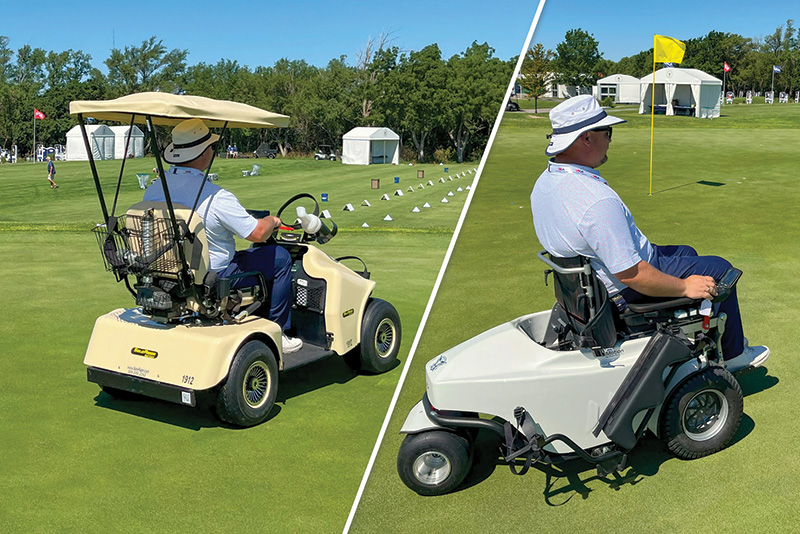
The two types of seated carts evaluated in the study were SoloRider (left) and ParaMotion (right). The SoloRider has a similar design as a standard golf cart but for a single rider, while the ParaMotion is designed for maximum maneuverability. Both have adjustable seats that allow players to position themselves as needed to make a swing.
Implications for golf courses and adaptive golfers
Accommodating seated players
The observations and preliminary results of these studies tell a positive story for golf courses that host adaptive players. Driving the most common types of seated carts across a putting green, even if it is relatively wet, had no long-term effect on the quality of the putting surface in this study. Any effects on trueness and smoothness that were observed were rare, small and temporary. More needs to be studied about how VWC influences putting green smoothness and trueness after traffic. Common sense would suggest that drier conditions would lead to less impact, but there are other factors involved. It’s also worth noting that the greens at Sand Creek Station were not rolled during the championship. Previous studies using the GS3 have found that daily rolling of putting greens significantly improves smoothness and trueness metrics and, in a way, “resets” the surface quality.
These findings are based on the specific types of carts, traffic patterns and putting greens used in this research. As mentioned at the start, little work has been done in this area, and we hope this pilot study encourages additional research in areas that are important to the adaptive golf community. Among other important topics, more research is needed to better quantify the effects of turning, multiple successive passes from a cart, the duration a cart sits in one place on a green (i.e., while a player is putting or waiting) and how tire inflation affects the legacy of traffic.
Courses accommodating seated players using other types of carts and golf courses with native soil putting greens may wish to exercise caution, especially following inclement weather. Golf course superintendents are experts in managing traffic and are an excellent resource for golf course decision-makers who have questions about when to allow seated carts on greens. Similar to the dreaded “cart path only” sign, there will be times when seated players may not be allowed on greens to protect the turf. Sand Creek Station’s superintendent, James Houchen, grew-in the golf course and has developed an intimate knowledge of the putting greens over his 20 years on-site. Ensuring the integrity of the putting surfaces during the championship was a priority, and Houchen did not have any concerns about seated carts driving on the greens at any time during the Adaptive Open. Superintendents at many courses hosting seated players have reported that single-rider, seated carts have a similar impact on the putting surface as a triplex mower (3).
Keep in mind that the USGA puts lots of thought and effort into selecting a golf course to host an Adaptive Open, accounting for criteria like the accessibility of the terrain, course features and many other factors. The reality is that not all courses may be able to accommodate seated carts at all times, but it is important that they make an effort. No matter the location or situation, there are steps courses can take to be more accessible for adaptive players.
Driving tips for seated players
Data and observations from this initial field study allow us to make some recommendations for adaptive golfers on how to traverse greens in a way that avoids or limits disruption of the putting surface. Traveling in straight lines and minimizing turning as much as possible is always a good idea, especially while on the putting green. If repositioning is required, it’s best to make wide turns or pull off the green to readjust your angle of approach, then drive onto the green in a straight line to your ball. Use extra caution if you must turn on a green, especially when using a para-type cart because the rear wheels can pivot quickly and mark the surface.
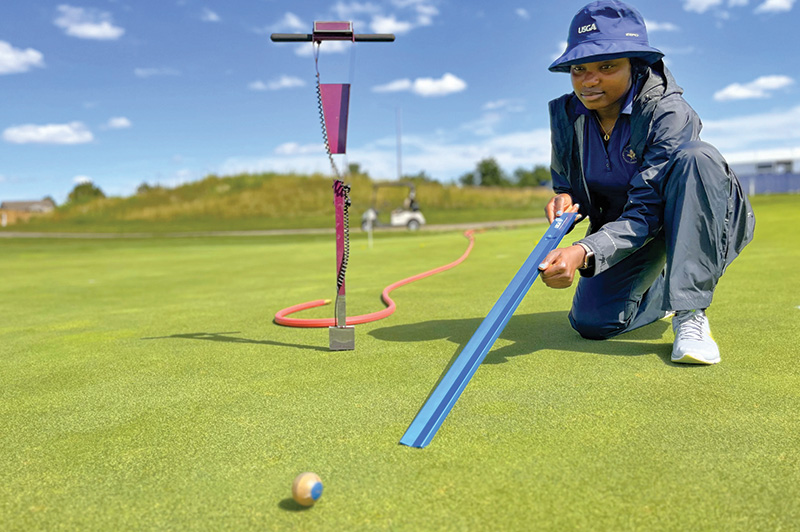
2024 Green Section intern and Kansas State University graduate student Olayemi Ojeokun assisted with data collection using the GS3 smart ball and DEACON app during the field studies.
Final thoughts
A primary goal of establishing the U.S. Adaptive Open is to catalyze more inclusion for golfers with disabilities in the United States and around the world. Our hope is that this research helps address concerns about allowing seated golf carts on putting greens and provides useful information about when impacts to the putting surface may occur and how long they are likely to last.
The research says
- Some adaptive golfers require the use of seated carts, but very little data is available about what, if any, impact these carts have on the putting green surface.
- Initial results from two field studies conducted during the 2024 U.S. Adaptive Open show no reduction in putting green smoothness or trueness after traffic is applied with a SoloRider seated golf cart at three volumetric water content levels.
- Some surface disruption was detected with a ParaMotion seated cart, but it was not consistent across all test plots and any effect observed was temporary.
- Multiple types of seated carts driving on the same green on the same day during the championship had little to no impact on surface smoothness. This initial finding is reassuring for courses hosting adaptive golf events with players using SoloRider, ParaMotion, VertaCat or similar carts.
- Potential effects may not be realized in a practical setting since cart use is typically restricted for several hours after a significant rain event. Impacts can also be mitigated with enhanced training of operators, specifically on how to properly maneuver a ParaMotion cart on putting greens.
Acknowledgements
The authors thank Stephanie Parel, Colton Dean and the U.S. Adaptive Open team for their support in conducting this research. We are especially grateful to golf course superintendent James Houchen and his staff for technical assistance. Eric Hatch and Deryck Jernigan of SoloRider Golf Cars provided the seated carts used in the study.
Literature cited
- Gentilucci, G., and A. Murphy. 1997. Putting green characteristics associated with surface depressions caused by selected forms of traffic (M.S. thesis, Rutgers University) (http://archive.lib.msu.edu/tic/thesdiss/gentilucci1997a.pdf).
- Gross, P.J. 2007. Golf course maintenance and the ADA: Maintaining a golf course for golfers with disabilities. USGA Green Section Record 45(2):1-8.
- Skorulski, J. 2018. Accommodating Golfers with Disabilities. United States Golf Association (https://www.usga.org/content/usga/home-page/course-care/forethegolfer/2018/accommodating-golfers-with-disabilities.html).
Appendix A
SoloRider specifications
- Weight: 573 lbs.
- Tire PSI: 22
- Tire Width: 8.5 inches
- Turning Radius: 5 feet 10 inches
- Power Source: 36-volt lithium battery
- Tire Tread: Front, straight ribbed/rear, sawtooth turf tires
- Top Speed: Programmed by SoloRider at 13 mph
ParaMotion specifications
- Weight: 467 lbs.
- Tire PSI: 22
- Tire width: 7 inches
- Turning radius: 3 feet 2 inches
- Power source: Two electric motors on the front axle, 550 watts each (24-volt operating system)
- Tire tread: Low speed lawn and garden tire (Kenda K505)
- Top speed: Typically limited to 6 mph
John Petrovsky (JPetrovsky@USGA.org) is manager of USGA Green Section Education, Wesley Stewart is a data scientist with the USGA Green Section, and Cole Thompson, Ph.D., is director of USGA Green Section Research, Pinehurst, N.C. Olayemi Ojeokun is a graduate student at Kansas State University, Manhattan.