
Technological advances in irrigation have contributed to overall decreases in water use at golf courses nationally. Photo courtesy of J. Bryan Unruh
Water is one of the most valuable, and most scrutinized, resources in golf course management. As drought cycles, regulatory pressure and rising costs continue to shape operations, golf course superintendents across the country are being asked to do more with less. Golf facilities collectively manage over 2 million acres of turf in the United States (20), and irrigation typically represents the largest share of operational water use (6, 16). The combination of public perception, escalating costs and oversight from water management agencies has pushed many facilities to reexamine how, when and how much they irrigate. Yet, for most superintendents, this stewardship is not merely a response to external pressure but a deeply held professional ethic — an intrinsic commitment to conserving water, protecting natural resources and ensuring the long-term sustainability of the game.
Even so, irrigation practices vary widely. Regional climate, turf species, soil type and available water sources all influence how golf course superintendents approach irrigation. Operational philosophy and financial capacity add yet another layer. Some facilities have embraced smart irrigation controllers, soil moisture sensors and advanced mapping tools, while others still rely on fixed schedules or visual observation (19). This diversity makes it difficult to paint a single picture of an industry “best management practice” and highlights the need for regionally tailored guidance.
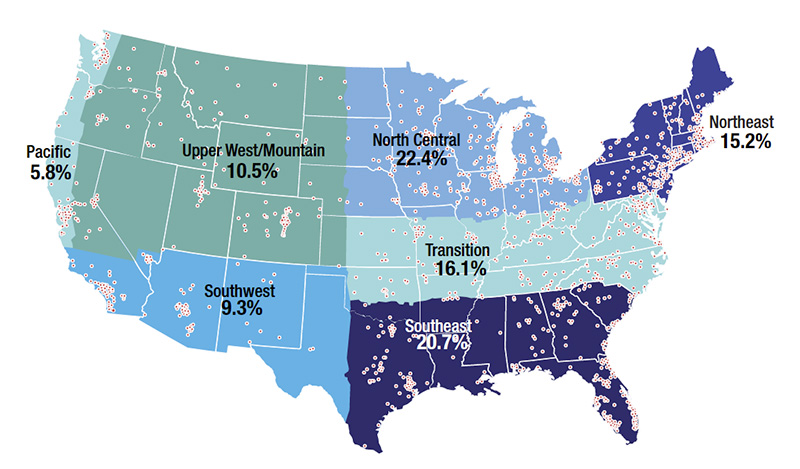
Figure 1. Distribution of 2024 survey responses and the seven agronomic regions.
Research over the years has demonstrated water savings from precision irrigation, improved scheduling and water-conscious cultural practices, albeit on small-scale levels (11, 15, 18). Many studies have focused on specific regions, systems or case studies — valuable insights, but not a full picture of how courses nationwide are adapting to modern water challenges.
Surveys have proven to be powerful tools in closing that knowledge gap. The GCSAA Golf Course Environmental Profile (GCEP), a national survey first conducted in 2005 (22), provided the first comprehensive look at water use across U.S. golf courses, revealing that while awareness of efficient irrigation tools was high, adoption lagged — often due to cost, staffing or site limitations. A subsequent survey documenting golf course water use in 2013 revealed that U.S. golf courses decreased water use by 21.8% and was attributed to a combination of factors, including increased use of management practices, voluntary acreage reductions, use of hand-held soil moisture sensors and a reduction in irrigated acres due to course closures (7). A third survey was conducted in 2020, with golf course superintendents self-reporting an additional 9% reduction in water use on U.S. golf courses (19). The reduction in applied water resulting from facility closures accounted for approximately one-third of the national total, with the remaining two-thirds probably resulting from more efficient use of water at operational facilities.
Now, nearly two decades after the inaugural survey, it’s time to ask: How have practices changed, and how are facilities managed under today’s environmental and regulatory realities? That was the goal of the 2024 GCEP Water Use Survey — to provide an updated benchmark for irrigation practices and water use across the U.S. The updated survey examined: 1. Current water use volumes by source and region; 2. Water use efficiency metrics; 3. Regional differences in irrigation practices; and 4. Water use management practices.
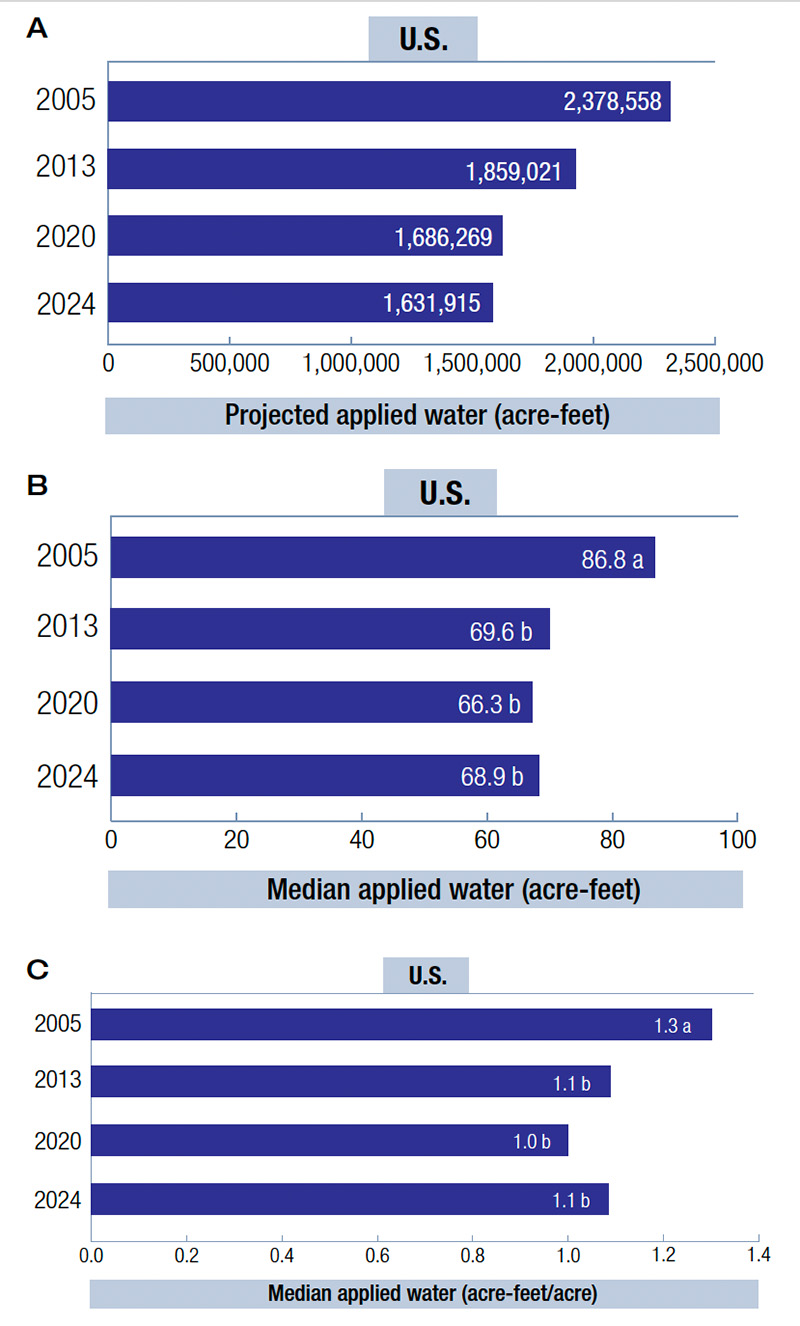
Figure 2. Water use among all U.S. golf facilities as (A) total projected applied water, (B) median applied water per golf facility and (C) median applied water per acre per golf facility in 2005, 2013, 2020 and 2024.
Methodology
The fourth phase of the GCEP water use survey mirrored previous surveys, ensuring continuity and reliable comparison across years. Only minor updates were made to clarify specific questions and improve ease of response.
Scientific oversight was led by Travis Shaddox, Ph.D., of Bluegrass Art and Science LLC, and J. Bryan Unruh, Ph.D., of the University of Florida. Their work focused on data analysis, interpretation and preparation of both the peer-reviewed journal manuscript and companion GCSAA publications. The National Golf Foundation managed the survey’s technical and logistical aspects, including instrument programming, distribution and data collation. NGF also computed projected national water use figures. Throughout the process, GCSAA staff coordinated closely with both the scientists and NGF to guide the project from design to publication.
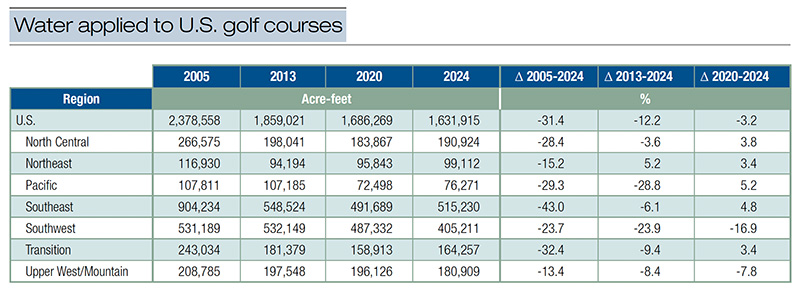
Table 1. Projected water applied to U.S. golf courses in 2005, 2013, 2020 and 2024.
Survey distribution and response
The survey link was distributed electronically through NGF and GCSAA mailing lists, reaching 13,952 golf facilities nationwide. A “facility” is defined as a discrete business location where one or more golf course is operated. For consistency with prior surveys, facilities were classified by agronomic region (Figure 1), facility type (daily-fee, municipal or private), number of holes (nine, 18 or 27-plus) and greens-fee category (<$40, $40-$70 or >$70 per round). Although each survey targeted the same population, respondents were not identical from phase to phase.
The survey remained open for seven weeks beginning Feb. 26, 2025, and was promoted through GCSAA communications and social media. Seven reminder emails were sent to encourage participation or completion. Responses were anonymized by assigning each facility a unique identification number, and only one response per golf course was used. A total of 1,766 golf course superintendents completed the survey — a 12.6% response rate, compared to 11.1% in 2020, 12.7% in 2013 and 15.2% in 2005.
Data analysis and interpretation
Survey data were merged with prior GCEP datasets to enable statistical comparisons over time. All results were weighted to accurately represent the U.S. golf facility population and analyzed using current statistical methods. Projected national water use and irrigated acreage were calculated as the sum product of regional means multiplied by the number of facilities within each region. Because these values represent modeled totals, statistical separation among regions was not applied. To ensure accuracy, responses based solely on measured data from water meters were used in the calculations.
Finally, management practices were analyzed for change over time by comparing survey years in pairs, allowing researchers to identify statistically significant shifts in golf course management practices.
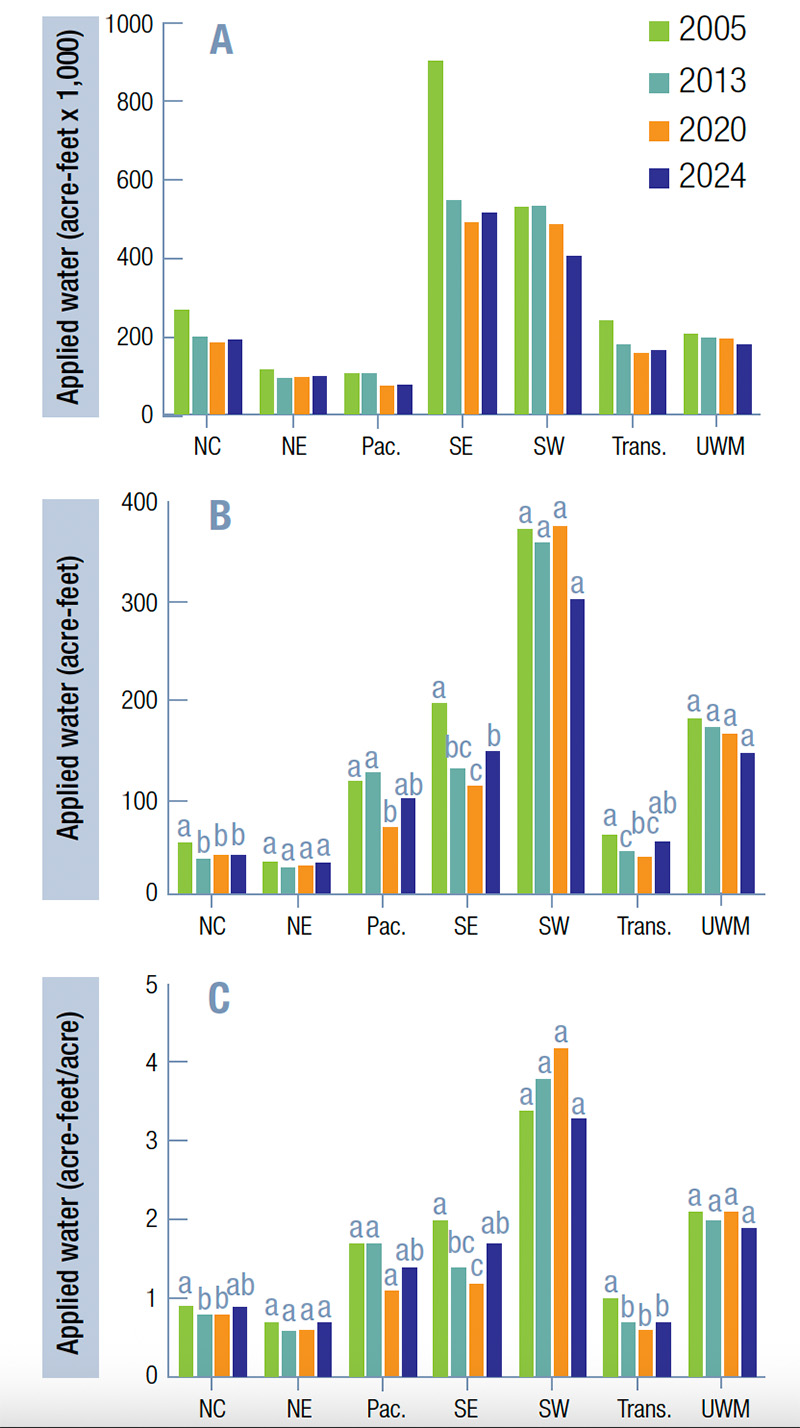
Figure 3. Water use among all U.S. golf facilities by agronomic region as (A) total projected water use, (B) median water use per golf facility and (C) median water use per acre per golf facility in 2005, 2013, 2020 and 2024. Projected values were not mean-separated. NC = North Central; NE = Northeast; Pac. = Pacific; SE = Southeast; SW = Southwest; Trans. = Transition and UWM = Upper West/Mountain.
Applied water units: What do they mean?
When it comes to reporting water use, three key units are used to describe “applied water” on golf courses:
- 1. Projected applied water (acre-feet).
- Projected applied water represents the “total estimated volume of irrigation water used” nationally or regionally. It is calculated by multiplying the average amount of water applied to nine-, 18- or 27-plus-hole facilities by the number of facilities of each type within a region. This provides an estimate of overall golf industry water use.
- 2. Median applied water (acre-feet).
- This value reflects the “middle point of water use” among all golf facilities — meaning half of the facilities apply more water and half apply less. It offers a representative snapshot of typical facility water use, regardless of course size.
- 3. Median applied water per acre (acre-feet per acre).
- This measure divides the median applied water by the facility’s irrigated acreage, providing a benchmark for “water-use efficiency.” It allows meaningful comparisons among facilities and regions with different course sizes and climates.
Quick reference: One acre-foot equals 325,851 gallons — or enough water to cover one acre of land with one foot of water.
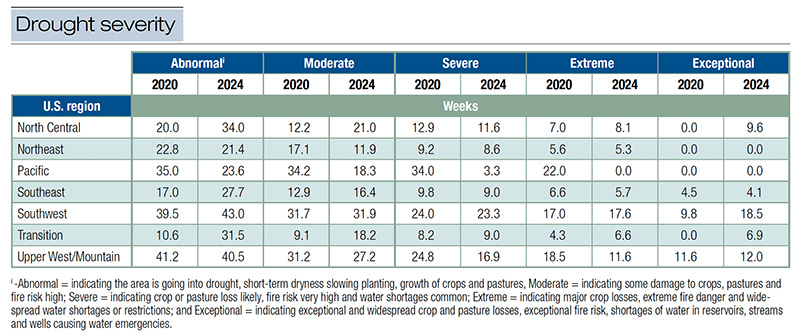
Table 2. Drought severity in the seven U.S. agronomic regions during 2020 and 2024.
Results
How golf course water use has changed over the past two decades
Results from the fourth GCEP survey reveal that total water use on U.S. golf courses continues to decline ever so slightly — 3% fewer acre-feet in 2024 than reported in 2020 (Figure 2A). Over the past two decades, water use on U.S. golf courses has been reduced 31%, signaling a broad trend toward improved water stewardship in the golf industry (21).
However, all regions except the Southwest and Upper West/Mountain reported a modest increase in water use of about 4% since 2020 (Table 1). In contrast, golf facilities in the Southwest recorded a notable 16.9% reduction in applied water during the same period. Similarly, the Upper West/Mountain region reported a 7.8% reduction. These reductions likely reflect a combination of stricter water use regulations, intensified public scrutiny of golf course irrigation practices (5), heightened water scarcity concerns among superintendents in the regions — reported to be ~17% higher than the national average (9) — and enhanced emphasis on the issue by golf-centric organizations through online content (http://bit.ly/4oCspLm) and educational venues (i.e., Southern California Golf and Water Summit (http://bit.ly/3IYIv2P) and the Colorado Basin Golf & Water Summit (http://bit.ly/3JouOtU)).
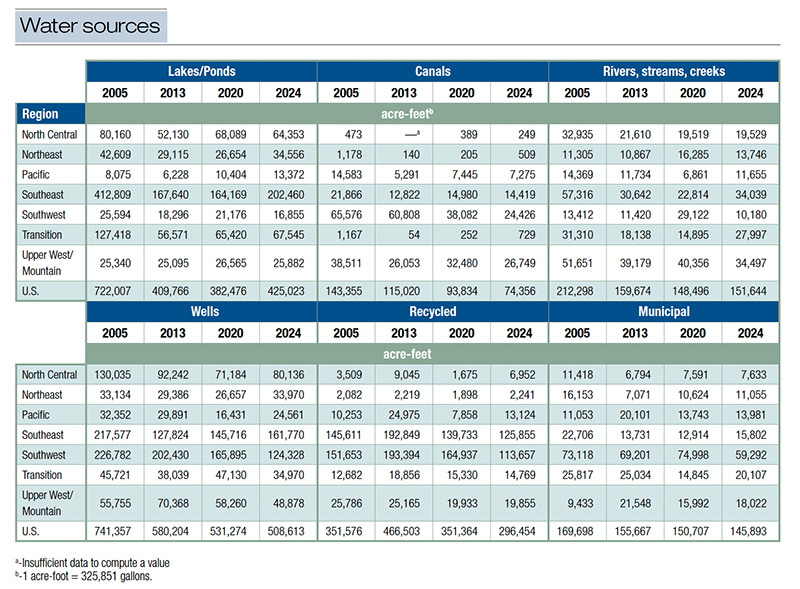
Table 3. Projected water applied nationally and within each agronomic region from lakes/ponds; canals; rivers, streams, creeks; wells; recycled; and municipal sources in 2005, 2013, 2020 and 2024.
The abc's of difference
Throughout this report, some tables and graphs contain letters, such as a, b or c next to numeric values. These letters indicate whether the values being compared are different.
Values followed by a common letter are not different at the 90% confidence level. This means that when we state that two values are different, we are 90% confident that the true values differ.
Water use efficiency and regional variation in golf course irrigation
At the national level, water applied per acre (acre-feet/acre) declined by 15% between 2005 and 2024 (Figure 2C). This reduction outpaced the 11% decrease in irrigated acres, suggesting that efficiency gains, in addition to a smaller overall golf footprint, have helped lower total water demand. However, these gains were not uniform across regions. While national water use per acre fell from 1.3 to 1.1 acre-feet per acre, only the Transition Region reported a consistent reduction during this period (Figure 3C). This contrasts with previous findings, where four of seven regions showed decreases in water use per acre between 2005 and 2020 (19). The shift may reflect differences in water demand or climatic variability, but it also highlights the ongoing need for education and advocacy to help policymakers and turf managers understand how golf turf can be maintained at high performance standards while maximizing irrigation efficiency (17, 18).
Golf courses in the Southwest and Upper West/Mountain regions reported the highest total and per-acre water use (Figure 3). These results align with the challenging environmental conditions typical of arid and semi-arid climates, persistent drought, elevated temperatures and limited rainfall, all contributing to higher evapotranspiration rates (3, 13). In 2024, the Southwest experienced 18.5 weeks of exceptional drought, roughly six weeks longer than the Upper West/Mountain region and more than twice the duration of any other region (Table 2). Not surprisingly, golf courses in this area used more than double the water per facility compared to other regions, underscoring the challenge of sustaining turfgrass quality in desert-adjacent environments.
Golf course irrigation, however, is not unique within the broader agricultural landscape. Water used to irrigate golf courses mirrors national irrigation trends observed in food and ornamental horticulture crops, where Western states consistently record the highest water demand (2). For instance, a recent USDA survey reported that Arizona’s 0.9 million acres of irrigated cropland required 3.9 million acre-feet of water (4.33 acre-feet/acre), while Florida’s 1.1 million irrigated acres used only 1.1 million acre-feet (1.0 acre-feet/acre) (23). This parallel underscores both the environmental realities and regional challenges faced by water-dependent industries, including golf.
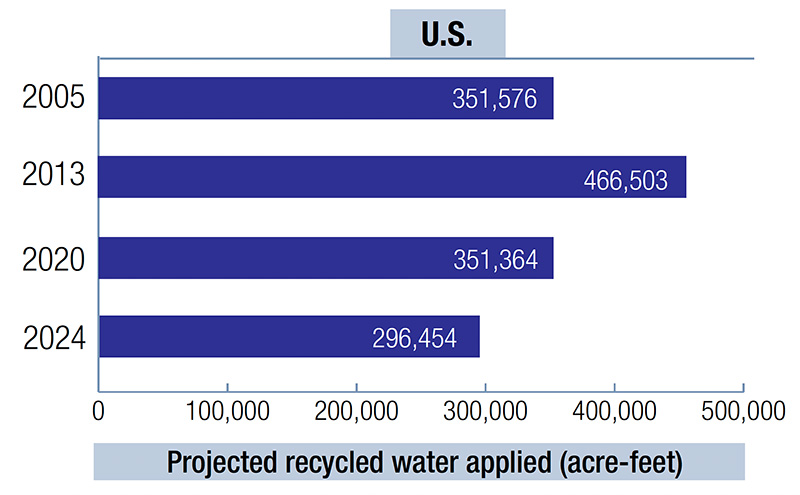
Figure 4. Projected recycled water applied to U.S. golf facilities in 2005, 2013, 2020 and 2024.
Shifting sources: How U.S. golf courses access irrigation water
In 2024, groundwater accessed via wells remained the primary irrigation source for U.S. golf courses, providing 508,600 acre-feet of water, followed closely by surface sources, lakes, ponds and streams, which contributed about 425,000 acre-feet (Table 3). Compared with 2020, withdrawals from open water bodies increased by 11%, while water withdrawals from wells declined by 4% nationwide.
Regional trends, however, tell a more complex story. Well-water use rose in four regions — North Central (+13%), Northeast (+27%), Pacific (+50%) and Southeast (+11%) — but fell in three others: Southwest (-25%), Transition (-26%) and Upper West/Mountain (-16%). This divergence likely reflects an evolving water management strategy, as facilities in some regions seek to reduce dependence on groundwater amid concerns about aquifer depletion and tightening state-level regulations (10). In contrast, surface water, though more variable and often more visible, may now be viewed as a more sustainable or publicly acceptable option, particularly in areas such as Arizona, where groundwater pumping is heavily monitored under Active Management Area frameworks (1).
A notable national shift was observed in the use of recycled (reclaimed) water, which in 2024 dropped to levels 15.7% below those reported in 2005 — the first recorded downturn since data collection began (Figure 4). This reversal breaks the two decade-long trends of steady growth in recycled water use across the golf industry.
The Southeast and Southwest remain the leading users, together accounting for 80% of all recycled water applied to golf courses — consistent with patterns reported in the three prior surveys. However, the Southwest’s recycled water use fell sharply, declining by roughly 51,000 acre-feet since 2020 and 38,000 acre-feet since 2005 — the first measurable drop in the region’s recycled water use since the 2005 baseline. Using recycled water to irrigate turfgrass offers multiple environmental and economic benefits, particularly by reducing demand for potable supplies (4). Understanding why usage has declined should be a priority for future research.
This trend toward less reclaimed water used for golf course irrigation underscores the growing competition for alternative water sources. Given the historical dependence on this water source, reduced access to recycled water is concerning. The continued reduction of reclaimed water may accelerate adoption of advanced irrigation technologies and drought-tolerant turfgrass species, an area well-suited for continued investigation in future surveys.
Despite the national downturn, recycled water use nearly doubled in the Pacific Region and quadrupled in the North Central Region since 2020. Though these gains represent only about 7% of the total recycled water used nationwide, they highlight regional opportunities for expanding reclaimed water programs. The underlying causes of these increases remain unclear but warrant further study to identify successful strategies that could inform broader adoption.
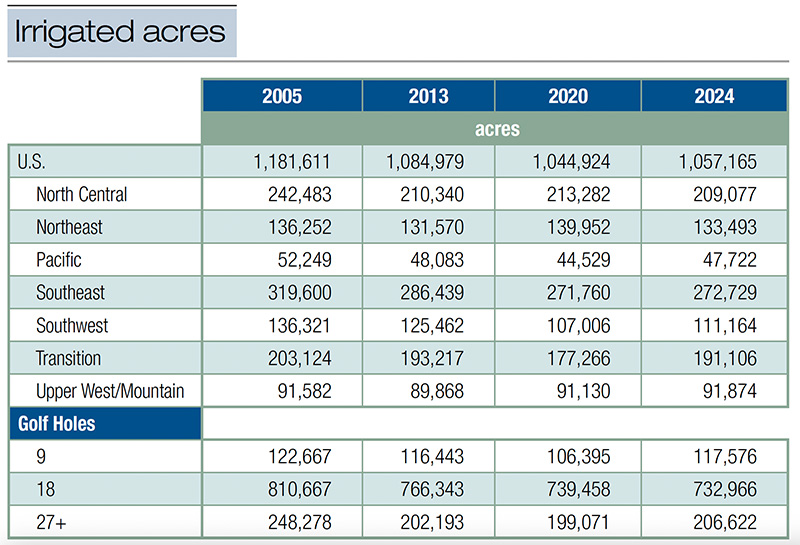
Table 4. Projected irrigated acres of U.S. golf courses in 2005, 2013, 2020 and 2024.
The changing footprint of irrigated turf on U.S. golf courses
In 2024, U.S. golf facilities collectively irrigated approximately 1.05 million acres of turfgrass — an 11% reduction since 2005 and 3% since 2013, though relatively stable compared to 2020 (Table 4). Most regions reported continued declines in irrigated acreage since 2005, with the Upper West/Mountain region standing as the lone exception, showing a modest 0.3% increase. The Southwest recorded the steepest proportional decline (-18%), while the Southeast posted the largest absolute reduction (-46,871 acres), helping explain much of the region’s overall drop in applied water. Interestingly, a 12,000-acre increase since 2020, primarily at nine-hole and 27-plus-hole facilities, suggests subtle shifts in course management priorities even as irrigated acreage at 18-hole courses continues to shrink.
Industry contraction and its impact on water use
The reduction in irrigated turf mirrors a broader contraction of the golf industry. Since 2005, the total number of U.S. golf facilities has declined by 14%, with regional losses ranging from 2% in the Upper West/Mountain to 17% in the Southeast. Roughly one-third of the national reduction in irrigation volume can be attributed directly to facility closures. The remainder reflects improved efficiency, driven by smarter irrigation scheduling, advanced soil moisture monitoring and more drought-tolerant turfgrass selections (22).
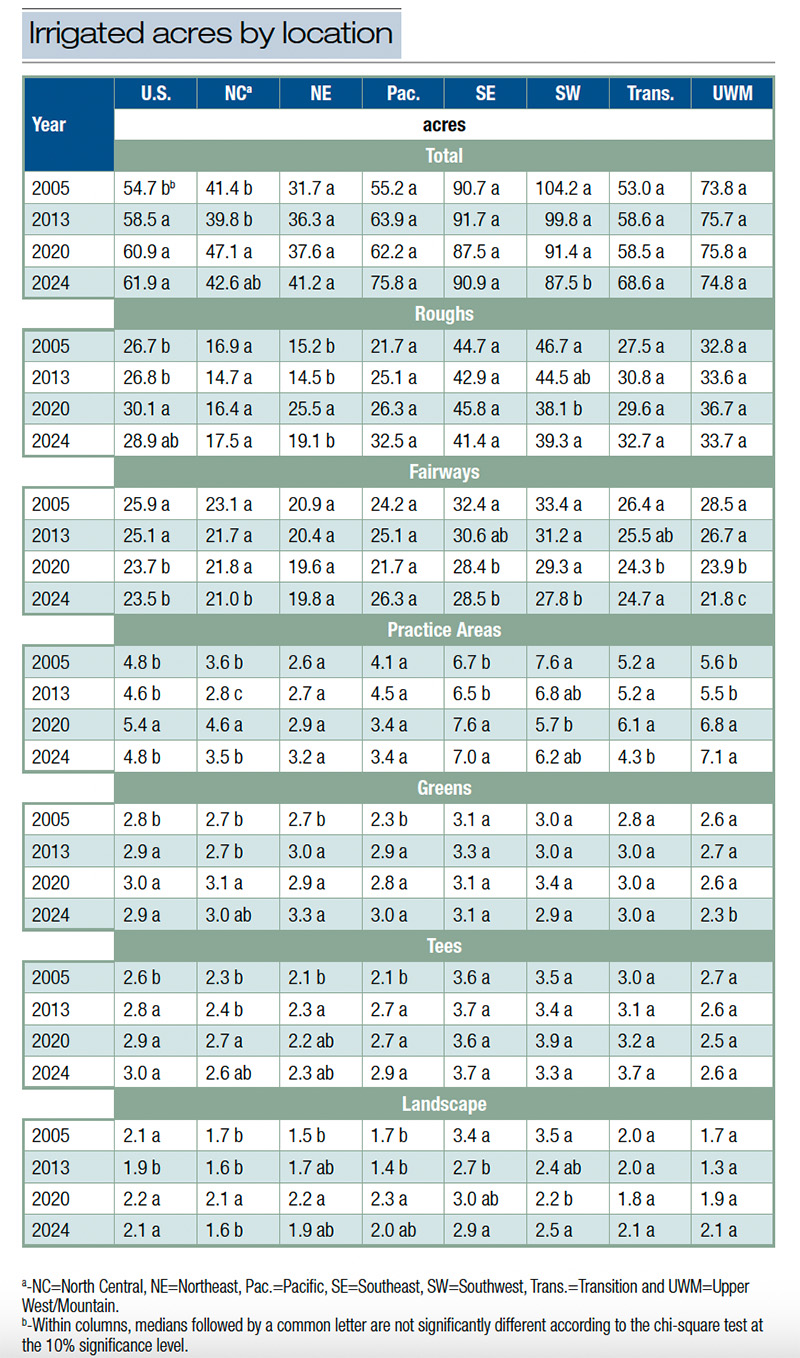
Table 5. Median irrigated acres of roughs, fairways, practice areas, greens, tees, landscape and total of all U.S. golf facilities in 2005, 2013, 2020 and 2024.
Shifts in median irrigated area
Although total irrigated acreage declined, the median irrigated acres per course increased by 13% from 2005 to 2024 (Table 5). This trend indicates that while fewer facilities remain, those still in operation often maintain larger irrigated footprints. The Northeast (+30%), Pacific (+37%) and Transition (+29%) regions experienced the largest increases, suggesting that reductions in total acreage stem primarily from course closures rather than reduced irrigation per facility. Conversely, the Southwest saw a 16% decline in median irrigated acres per course, consistent with persistent water scarcity and allocation limits in that region (8).
Where the water goes: Roughs, fairways and play areas
Roughs and fairways together make up about 85% of irrigated turf, making these course features prime targets for conservation (Table 5). While median irrigated rough acreage rose 8.2% since 2005, it has declined by 4% since 2020, indicating growing restraint in lower-priority areas. Fairway acreage decreased nationally by 9.3% since 2005, with the Pacific Region being the only area to post gains, +9% since 2005 and +21% since 2020, likely reflecting regional conditions and expectations. Targeting irrigation reductions in roughs and out-of-play areas could yield water savings with limited impact on playability (24).
Smaller but high-use areas also shifted. Nationally, greens and tees increased 4% and 15%, respectively, since 2005, though the gains were concentrated in specific regions — green acreage expanded by 22% in the Northeast and 30% in the Pacific. Conversely, practice and landscape areas contracted, especially after 2020; practice areas alone declined 11% nationally, and by as much as 30% in the Transition Region, possibly reflecting economic pressures or changing priorities.
Analysis by facility size revealed that nine-hole courses generally apply less water per acre than larger facilities (Table 6). While their median irrigated acreage grew 10% since 2005, total and per-acre water use remained stable, suggesting greater efficiency or smaller irrigated areas per hole. Meanwhile, 18-hole golf courses reduced their total applied water by 20% since 2005. Given that nine-hole and 27-plus-hole facilities together account for about 31% of total irrigation water used nationwide, targeted educational outreach toward these segments represents an opportunity for further reductions in golf’s overall water footprint.

Table 6. Median irrigated acres, acre-feet, and acre-feet per acre at nine-, 18- and 27-plus-hole facilities in the U.S. in 2005, 2013, 2020 and 2024.
Evolving water conservation strategies on U.S. golf courses
Water conservation strategies on U.S. golf courses have evolved over the past two decades, reflecting both technological advancement and a growing emphasis on environmental stewardship. In 2024, the most common irrigation-related practices included wetting agent applications (96%), hand-watering (83%) and intentionally maintaining turfgrass in a drier condition than in the past (65%) (Table 7). Wetting agents have consistently been ranked as the most widely used water-management tool in each GCEP survey cycle. After sharp increases in adoption through 2020, these practices have now stabilized, as their use is widespread.
Notably, 2024 marked the first year that more than half of golf course superintendents reported using hand-held soil moisture sensors (55%) and formal irrigation scheduling programs (53%). Among all practices tracked, the adoption of hand-held sensors showed the largest increase, rising from 33% in 2013 to 55% in 2024. This growth likely reflects improvements in affordability, ease of use and reliability (14). Although these tools are designed to improve irrigation efficiency, national-scale data confirming measurable water-use reductions remain limited, underscoring the need for further study linking practice adoption with actual conservation outcomes. Even so, their rising popularity signals increasing superintendent awareness and commitment to water stewardship.
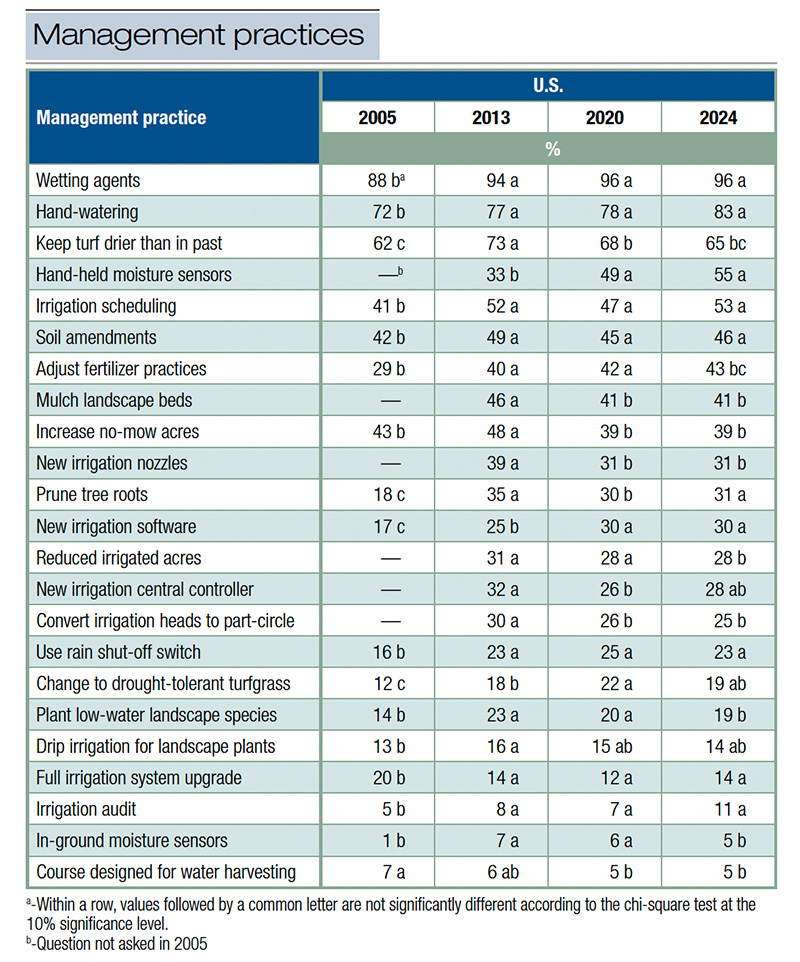
Table 7. Management practices used by survey respondents in 2005, 2013, 2020 and 2024.
Growing emphasis on irrigation audits
Of the 23 management techniques included in the 2024 survey, only three saw increased adoption since 2020: hand-held moisture sensors, irrigation scheduling and irrigation audits. Irrigation audits, structured evaluations used to assess system performance and identify inefficiencies, are fundamental to improving water distribution (12). Once uncommon, their use has more than doubled since 2005, with 11% of respondents now conducting audits, up from 5% nearly two decades earlier. This modest rise likely reflects regulatory encouragement, voluntary superintendent initiatives and promotion by professional associations such as GCSAA and regional turfgrass organizations. Though the reported increase in irrigation audits is laudable, all golf course superintendents should conduct irrigation audits on their golf courses, as they are essential for identifying inefficiencies, optimizing water distribution uniformity and ensuring responsible water use.
Infrastructure and system modernization
While the adoption of many irrigation infrastructure upgrades has plateaued, the overall picture suggests steady modernization. For example, installation of new sprinkler heads (60%) and nozzles (50%) has remained consistent since 2005, while automated irrigation systems reached 77% adoption in 2024, showing no change since 2020 (Table 8). In contrast, the use of manual and semi-automatic systems declined by 12% and 25%, respectively, since 2005, illustrating the gradual industry-wide shift toward full automation.
Beyond these long-term trends, five key system upgrades were reported more frequently in 2024: new irrigation software controls, master controllers, pumps, and main and lateral irrigation lines. These technologies represent the next generation of water management tools:
- Smart controllers and software now allow automated scheduling that integrates weather data and soil moisture sensors, applying water precisely when and where it’s needed.
- Modern pump systems equipped with variable-frequency drives improve energy efficiency, ensure consistent water pressure and enable real-time monitoring to reduce downtime and waste.
- High-density polyethylene (HDPE) piping is increasingly replacing older PVC infrastructure, minimizing leaks, corrosion and joint failures while maintaining stable pressure for more uniform coverage.
- While these advancements should theoretically yield greater efficiency, a direct correlation between system upgrades and measurable water-use reduction has not yet been demonstrated at a national scale — highlighting a key opportunity for future research.
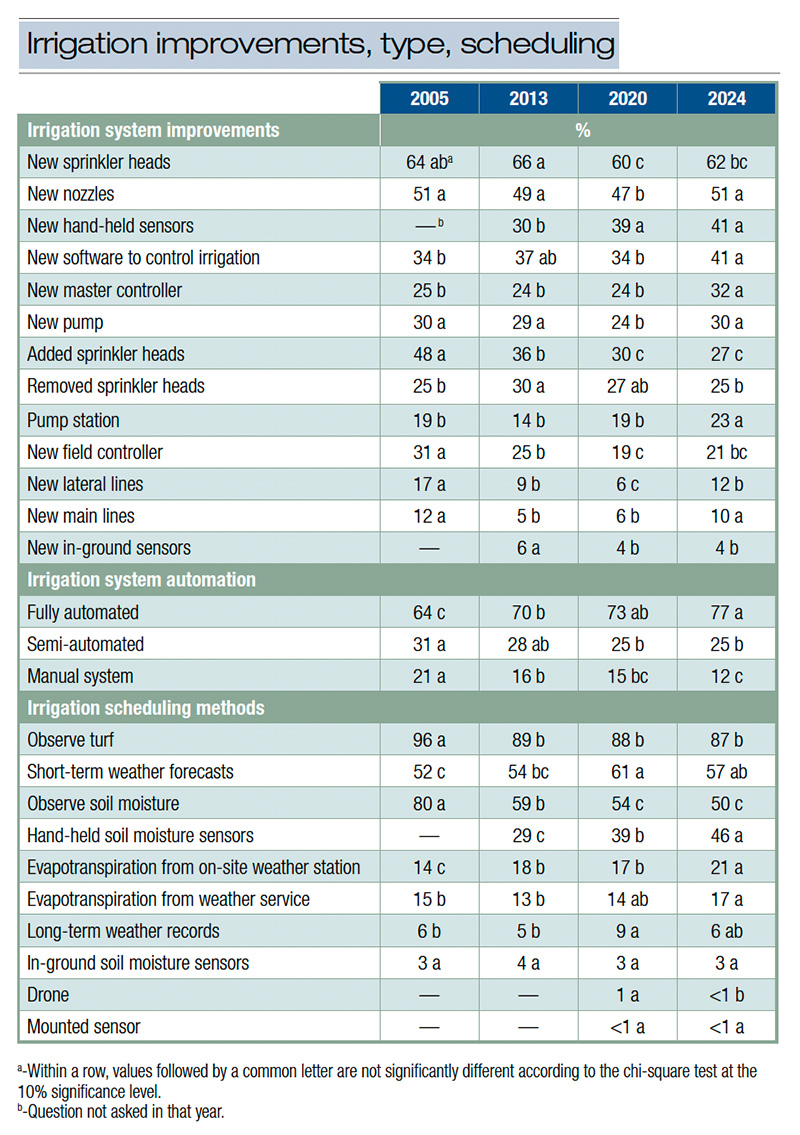
Table 8. Irrigation system improvements, system type and scheduling methods used by respondents in 2005, 2013, 2020 and 2024.
From subjective to objective decision-making
Irrigation decision-making on golf courses continues to shift from subjective observation to data-driven methods. Although visual turf assessment remains the most common approach to assessing irrigation needs, its use has declined from 96% of facilities in 2005 to 87% in 2024. Meanwhile, reliance on hand-held soil moisture sensors increased to 46% (up from 29% in 2013), and on-site evapotranspiration-based scheduling rose to 21%, compared with 14% in 2005. Together, these shifts illustrate the industry’s steady movement toward precision irrigation, where decisions are guided less by intuition and more by quantifiable field data — a trend that continues to redefine modern turfgrass water management.
Opinions of golf course superintendents on water-related issues
Water scarcity and cost perceptions: Nationally, most golf course superintendents reported that water scarcity and cost were not identified as major concerns (Table 9). Approximately 45% reported no concern about water scarcity, and 49% indicated no concern about water cost at this time. The remaining respondents expressed varying levels of concern, with responses distributed along a gradually increasing scale (2-5 points), suggesting that for many golf course superintendents, these factors play at least some role in their water-management decisions. Regional differences were evident, however. Respondents from the Southwest reported significantly higher concern levels for both water scarcity and cost — reflecting the region’s ongoing challenges with drought, regulation and resource competition.
Golfer receptiveness to reduced water use: Overall, golf course superintendents report that golfers were largely receptive to course appearance and playability changes resulting from reduced irrigation in 2024 (Table 10). Nationally, 62.8% of respondents rated golfer receptiveness at the upper end of the scale (4 or 5 on a 1-5 scale, where 5 = very receptive), while only 11.2% rated receptiveness as low (1 or 2).
Regional patterns were broadly consistent, with the Northeast (68.1%) and Upper West/Mountain (72.2%) regions reporting the highest golfer receptiveness, suggesting strong acceptance of conservation-related management adjustments. The Pacific (70.5%) and Transition (63.2%) regions followed closely. In contrast, the Southwest showed a more mixed response; only 46.4% of respondents rated golfer receptiveness as high (4 or 5), and 16% rated it low (1 or 2), perhaps reflecting heightened sensitivity to visible drought stress or stricter water-use limitations in this region.
These findings indicate that across much of the U.S., golf course superintendents believe that golfers have adapted positively to reduced water use, particularly where communication and conditioning practices effectively maintain playability despite drier course conditions. However, superintendents’ view of golfer receptivity has not resulted in reduced water use, as evidenced by increased water use in most regions. Conversely, water use in the Southwest has been reduced despite the perceived negative receptivity of golfers.
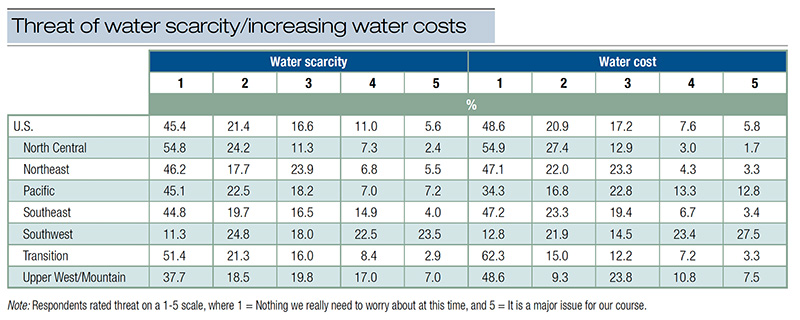
Table 9. Threat of water scarcity or increasing water costs on U.S. golf facilities in 2024.
Influence of regulations on golf course irrigation
Since 2005, regulatory oversight of golf course water use has evolved in several ways. Required water-use reporting increased from 48.4% to 57.5%, and the proportion of facilities operating under annual water allocations rose from 21.7% to 28.7%. In contrast, mandatory water restrictions declined from 15.8% to 12.1% (Table 11), suggesting a gradual shift toward reporting and allocation-based management rather than blanket restrictions.
In 2024, the adoption of formalized water management plans, including drought, water-use, stormwater and preventative irrigation plans, remained limited (Table 12). Among facilities that do maintain written plans (excluding stormwater plans), the majority implemented them voluntarily, rather than in response to regulatory mandates.
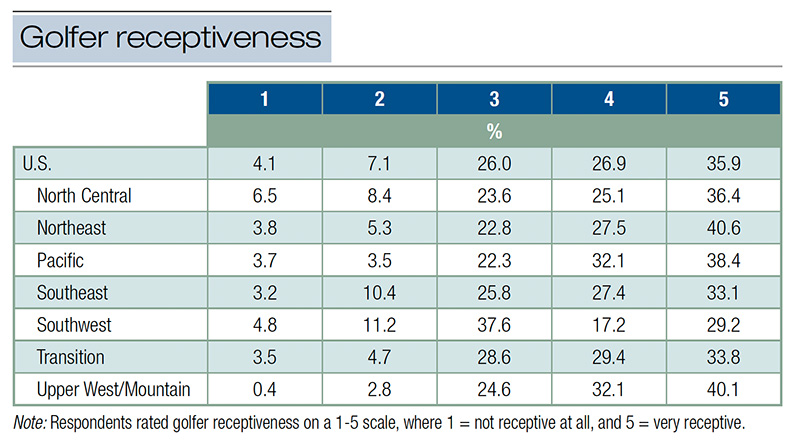
Table 10. Golfer receptiveness resulting from reduced water use and any perceived change in course appearance and playability among U.S. golf facilities that reported a reduction in water use in 2024.
A paradigm shift: From conservation to stewardship
Over the past two decades, the story of golf course water use in the United States has been one of steady progress, increasing precision and growing stewardship. The 2024 GCEP water survey results confirm that the industry has continued to make strides in water use, achieving a 31% reduction in total irrigation volume since 2005. While regional differences persist, particularly in the arid Southwest and Upper West/Mountain regions, golf course superintendents nationwide have, to some degree, demonstrated a commitment to responsible resource management through technology adoption, infrastructure modernization and refined irrigation practices.
Today’s golf courses are managed with greater data-driven precision than ever before. Where efficiency gains were measured, they appear to be driven by technological advancements, including the adoption of moisture sensors and ET-based irrigation scheduling, and improved management practices, such as system audits and data-informed decision-making. Since 2020, many superintendents have increasingly relied on objective measures to guide irrigation, and facilities have invested in infrastructure upgrades that enhance system performance and reliability. Even though some regions reported slight increases in water use since 2020, these fluctuations likely reflect localized climate variability, regulatory changes and facility-level adaptation, rather than regression. Importantly, water conservation must shift from a reactive measure to more of an integrated part of daily management philosophy.
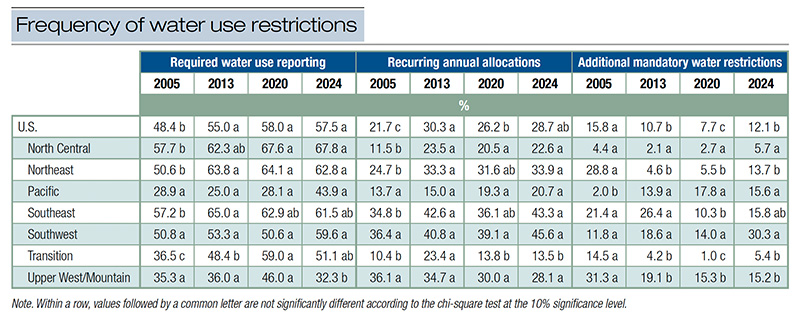
Table 11. Frequency of water use restrictions at U.S. golf facilities in 2005, 2013, 2020 and 2024.
The observed decline in recycled water use is concerning, particularly in water-scarce regions, as it reflects growing competition for non-potable supplies among urban, industrial and environmental users. Despite two decades of advocacy for reclaimed water as a sustainable irrigation source, access has become more limited in some areas, exposing the vulnerability of golf’s alternative water strategies. This trend underscores the need for renewed collaboration between golf facilities, municipalities and regulators, as well as continued investment in education, applied research and advocacy to drive innovation in irrigation efficiency, turfgrass breeding and water policy reform.
Encouragingly, golf course superintendents believe that golfers themselves are increasingly receptive to drier course conditions and the visual differences that accompany water conservation. This growing acceptance should give superintendents confidence when lobbying their management for greater water-use efficiency practices that would enhance the facility’s sustainability without compromising the golfer’s experience.
Golf courses serve as living laboratories of sustainable water management, showing that aesthetics, performance and environmental responsibility can coexist — even under tightening environmental, economic and regulatory pressures. The 2024 data reflect an industry in transition, as golf course superintendents navigate access to water and rising scrutiny while continuing to make measurable progress. Yet recent reductions in water use are modest and call for renewed commitment and resolve. True, lasting success will depend on systemic change — regionalized policies, stronger data transparency and sustained investment in drought-adapted turfgrasses and irrigation efficiency, along with gaining an understanding of golfer expectations to help foster measurable water use reductions. Still, the path forward is inspiring: Through collaboration among superintendents, scientists, policymakers and golfers alike, the golf industry can continue leading by example and proving that every drop truly counts.
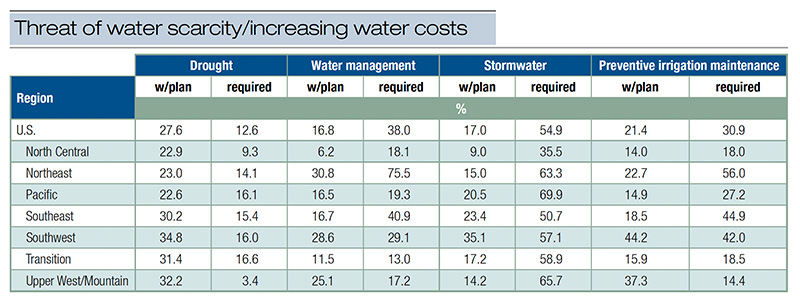
Table 12. Frequency of U.S. golf facilities that have a written drought, water management, stormwater or preventive irrigation maintenance plan in 2024. For those respondents with written plans, the “required” columns indicate the frequency with which those plans were required by state or local authorities.
The research says
- Results from the fourth GCEP survey reveal that total water use on U.S. golf courses continues to decline ever so slightly — 3% fewer acre-feet in 2024 than reported in 2020. Over the past two decades, water use on U.S. golf courses has been reduced 31%, signaling a broad trend toward improved water stewardship in the golf industry.
- At the national level, water applied per acre (acre-feet/acre) declined by 15% between 2005 and 2024. This reduction outpaced the 11% decrease in irrigated acres, suggesting that efficiency gains, in addition to a smaller overall golf footprint, have helped lower total water demand.
- In 2024, groundwater accessed via wells remained the primary irrigation source for U.S. golf courses, providing 508,600 acre-feet of water, followed closely by surface sources, lakes, ponds and streams, which contributed about 425,000 acre-feet.
- In 2024, U.S. golf facilities collectively irrigated approximately 1.05 million acres of turfgrass — an 11% reduction since 2005 and 3% since 2013, though relatively stable compared to 2020.
- Roughs and fairways together make up about 85% of irrigated turf, making these course features prime targets for conservation. While median irrigated rough acreage rose 8.2% since 2005, it has declined by 4% since 2020, indicating growing restraint in lower-priority areas.
- Water conservation strategies on U.S. golf courses have evolved over the past two decades, reflecting both technological advancement and a growing emphasis on environmental stewardship. In 2024, the most common irrigation-related practices included wetting agent applications (96%), hand-watering (83%) and intentionally maintaining turfgrass in a drier condition than in the past (65%).
Literature cited
- Arizona Department of Water Resources. 2021. Fifth management plan for the Phoenix active management area (https://new.azwater.gov/ama/management-plans).
- Dieter, C.A., M.A. Maupin, R.R. Caldwell, M.A. Harris, T.I. Ivahnenko, J.K. Lovelace, N.L. Barber and K.S. Linsey. 2018. Estimated use of water in the United States in 2015. U.S. Geological Survey (https://doi.org/10.3133/cir1441).
- Diffenbaugh, N.S., D.L. Swain and D. Touma. 2015. Anthropogenic warming has increased drought risk in California. Proceedings of the National Academy of Sciences 112(13):3931-3936 (https://doi.org/doi:10.1073/pnas.1422385112).
- Evanylo, G., E. Ervin and X. Zhang. 2010. Reclaimed water for turfgrass irrigation. Water 2(3):685-701 (https://doi.org/10.3390/w2030685).
- Fabok, B. 2022. Arizona golf courses use more water than they're supposed to. Nothing is stopping them. Golfweek https://golfweek.usatoday.com/story/sports/golf/2022/08/01/arizona-golf-courses-more-water-than-allotted/76442224007/).
- Fidanza, M. 2022. Turfgrass is not the largest irrigated crop. Golf Course Management 90(6):62.
- Gelernter, W.D., L.J. Stowell, M.E. Johnson, C.D. Brown and J.F. Beditz. 2015. Documenting Trends in Water Use and Conservation Practices on U.S. Golf Courses. Crop, Forage & Turfgrass Management 1:1-10 (https://doi.org/10.2134/cftm2015.0149).
- Gober, P., C.W. Kirkwood, R.C. Balling Jr., A.W. Ellis and S.Deitrick. 2010. Water planning under climatic uncertainty in Phoenix: Why we need a new paradigm. Annals of the Association of American Geographers 100(2):356-372 (https://doi.org/10.1080/00045601003595420).
- Golf Course Superintendents Association of America. 2022. Golf course environmental profile water use and management practices on U.S. Golf courses. GCSAA (https://www.gcsaa.org/docs/default-source/environment/22_waterreport_web.pdf).
- Grafton, R.Q., D. Garrick, A. Manero and T.N. Do. 2019. The water governance reform framework: Overview and applications to Australia, Mexico, Tanzania, U.S.A and Vietnam. Water 11(1):137 (https://doi.org/10.3390/w11010137).
- Harivandi, M.A., J. Baird, J. Hartin, M. Henry and D. Shaw. 2009. Managing turfgrasses during drought. Publication No. 8395. University of California, Agriculture and Natural Resources (https://doi.org/10.3733/ucanr.8395).
- Hilaire, R.S., M.A. Arnold, D.C. Wilkerson, D.A. Devitt, B.H. Hurd, B.J. Lesikar, V.I. Lohr, C.A. Martin, G.V. McDonald, R.L. Morris, D.R. Pittenger, D.A. Shaw and D.F. Zoldoske. 2008. Efficient water use in residential urban landscapes. HortScience 43(7):2081-2092 (https://doi.org/10.21273/hortsci.43.7.2081).
- Intergovernmental Panel on Climate Change. 2023. Climate change 2021 — The physical science basis. Cambridge University Press (https://doi.org/10.1017/9781009157896).
- Magro, C., S. Macolino, C. Pornaro, M. McMillan and M. Fidanza. 2022. Considerations with determining the minimum number of volumetric water content measurements for turfgrass root zones. Agronomy 12(6):1402 (https://www.mdpi.com/2073-4395/12/6/1402).
- Meza, K., A.F. Torres-Rua, L. Hipps, K. Kopp, C.M. Straw, W.P. Kustas, L. Christiansen, C. Coopmans and I. Gowing. 2025. Relating spatial turfgrass quality to actual evapotranspiration for precision golf course irrigation. Crop Science 65(1):e21446 (https://doi.org/https://doi.org/10.1002/csc2.21446).
- Milesi, C., C.D. Elvidge, J.B. Dietz, B.T. Tuttle, R.R. Nemani and S.W. Running. 2005. A strategy for mapping and modeling the ecological effects of US lawns. International Society for Photogrammetry and Remote Sensing (https://www.isprs.org/proceedings/XXXVI/8-W27/milesi.pdf).
- Nolan, G., and M. Fidanza. 2024. Evaluation of two soil surfactants for soil water management of creeping bentgrass on a wettable clay loam rootzone during an imposed dry-down period. Journal of Environmental Horticulture 42(1):40-45 (https://doi.org/10.24266/0738-2898-42.1.40).
- Schiavon, M., and M. Serena. 2023. Advances in irrigation and water management of turfgrass. In M. Fidanza (Ed.), Achieving sustainable turfgrass management (pp. 157-196). Burleigh Dodds Sci. Publ. (https://doi.org/10.19103/AS.2022.0110.05).
- Shaddox, T.W., J.B. Unruh, M.E. Johnson, C.D. Brown and G. Stacey. 2022. Water use and management practices on U.S. golf courses. Crop, Forage & Turfgrass Management 8:e20182 (https://doi.org/10.1002/cft2.20182).
- Shaddox, T.W., J.B. Unruh, M.E. Johnson, C.D. Brown and G. Stacey. 2023. Land-use and energy practices on US golf courses. HortTechnology 33:296-304 (https://doi.org/10.21273/horttech05207-23).
- Shaddox, T.W., J.B. Unruh, J. Tapp, C.D. Brown, G. Stacey and E. Fuger. 2025. Survey of water use and management practices on U.S. golf courses from 2005 to 2024. HortTechnology 35(5):848–857 (https://doi.org/10.21273/HORTTECH05716-25).
- Throssell, C.S., G.T. Lyman, M.E. Johnson, G.A. Stacey and C.D. Brown. 2009. Golf course environmental profile measures water use, source, cost, quality, and management and conservation strategies. Online. Applied Turfgrass Science (https://doi.org/10.1094/ATS-2009-0129-01-RS).
- USDA National Agricultural Statistics Service. 2024. 2023 irrigation and water management survey. (https://www.nass.usda.gov/Publications/AgCensus/2022/Online_Resources/Farm_and_Ranch_Irrigation_Survey/iwms.pdf).
- United States Golf Association. 2025. Water conservation playbook (https://www.usga.org/content/dam/usga/images/course-care/water-resource-center/Water_Conservation_Playbook/24GS_15-30-45_Playbook_FULLBOOK.pdf).
J. Bryan Unruh, Ph.D., (jbu@ufl.edu) is a professor and associate center director at the University of Florida, Institute of Food and Agricultural Sciences’ West Florida Research and Education Center in Jay, Fla. Travis Shaddox, Ph.D., is president of Bluegrass Art and Science LLC, Lexington, Ky.