Sulfur (S) is a plant-essential macronutrient required for critical metabolic processes, including the synthesis of amino acids, which are required to produce proteins. In the absence of S, turfgrass growth slows, and plants become chlorotic. Historically, industrial emissions from coal-burning power plants and other anthropogenic processes released massive quantities of sulfur dioxide (SO2) into the atmosphere. This S eventually returned to the earth via rainfall, a phenomenon often referred to as acid rain. In 1990, atmospheric deposition of S in the eastern United States exceeded 0.5 pounds per 1,000 square feet (24 kilograms per hectare) per year, which was likely more than enough to meet the requirements of most turfgrass species (Figure 1).
The landscape changed with the Clean Air Act of 1990. This legislation established strict national air quality standards that forced industries to drastically reduce SO2 emissions. The environmental success of this act is axiomatic. However, a consequence of this 96% reduction in S deposition since 1990 has been an increase in S deficiency in cultivated crops and turfgrasses that are not regularly fertilized with sulfate-based fertilizers. Unfortunately, no reliable method of predicting S deficiency for turfgrasses, such as soil or tissue testing, exists. In many cases, soil testing has some meaningful predictive value for elements such as phosphorus and potassium, but S is rarely included due to a lack of correlation and calibration between soil test results and a turfgrass response to applied S.
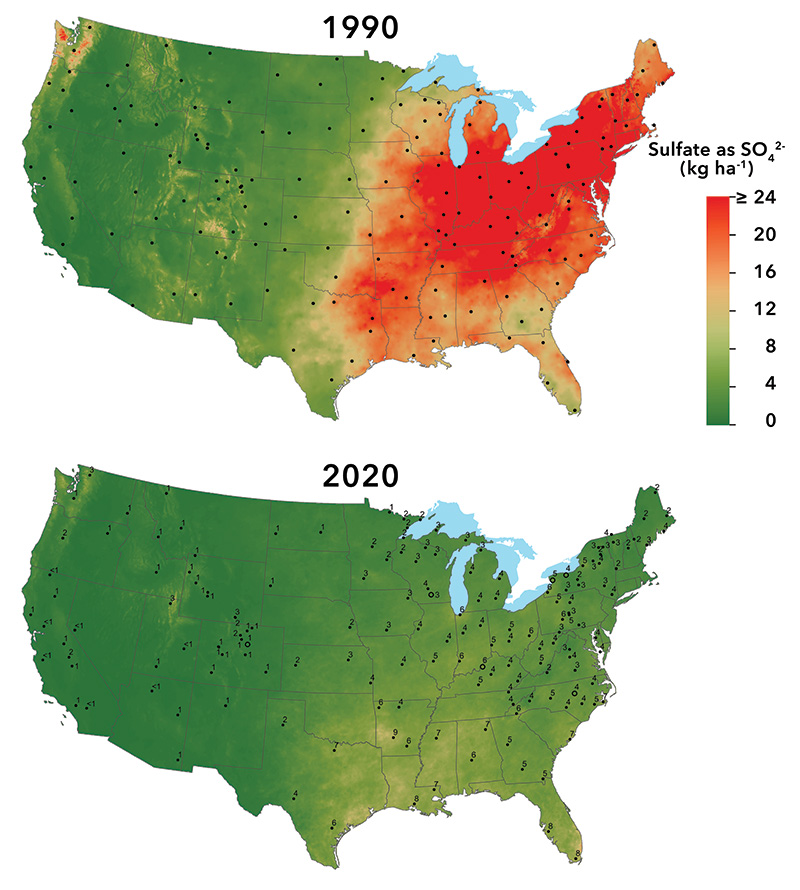
Figure 1. Sulfur deposition in the United States when the Clean Air Act of 1990 was passed into law and in 2020 (NADP, 2022).
Experimental design
To address the lack of soil test calibration for S, four field trials were conducted between September 2021 and May 2023 on a commercial sod farm in Fayette County, Ky. The site was a commercially active sod farm specifically chosen because the Kentucky bluegrass remained chlorotic and grew poorly despite receiving more than 1 pound of nitrogen (N) as urea. A pilot study confirmed that the turfgrass only responded to N when it was accompanied by an S source, such as magnesium sulfate or calcium sulfate, diagnosing the site as potentially S deficient (Figure 2).
The soil at the site was a Maury silt loam with an organic matter concentration of 2.9% and a pH between 6.2 and 6.6. This provided an ideal environment for testing, as S mineralization from organic matter is often insufficient to meet plant needs when organic matter levels are below 4%. The experimental design was a randomized complete block with four replications. Treatments consisted of granular potassium sulfate applied at 0, 0.08, 0.17, 0.25 and 0.34 pounds of S per 1,000 square feet (0, 3.91, 8.3, 12.21 and 16.6 kilograms S per hectare). To ensure turfgrass response was not a result of the added potassium, control plots received potassium from potassium chloride in an amount equal to the potassium applied in the high S treatment. To ensure that N was not a limiting factor, all plots received 1 pound of N per 1,000 square feet as urea at the initiation of each trial. Data collection included turfgrass quality, normalized difference vegetation index (NDVI), clipping yield and leaf tissue nutrient content. Soil samples from the top 6 inches (15.2 centimeters) were taken before and during each trial to correlate turfgrass responses with Mehlich-3 extractable S levels.
Results and discussion
Turfgrass quality and visual response
Sulfur fertilization resulted in increased turfgrass quality in three of the four experiments. The greatest response to applied S occurred in autumn 2021 and spring 2022 when the initial soil S levels were lowest among the four experiments. During the autumn 2021 and spring 2022 experiments, turfgrass quality averaged 4.1 and 3.4, respectively, from the nontreated turfgrass, whereas turfgrass quality increased to 6.0 and 5.3 following the application of S at 0.34 pounds per 1,000 square feet.
When the maximum turfgrass quality occurred during each experiment, soil samples were taken and analyzed for Mehlich-3 S. Soil S was then correlated to turfgrass quality. As a result, it was determined that the critical Mehlich-3 soil S concentration for acceptable turfgrass quality (a score of 6.0 or higher) ranged from 3.1 to 5.7 ppm (Figure 3). When initial soil S levels were already above 8.4 ppm, as was the case during the autumn 2022 trial, applying additional S resulted in no improvement in quality. This finding is vital for turf managers, as it defines a clear threshold above which S applications are likely a waste of resources.
It should be noted that turfgrass did not respond well to applied S during the autumn 2022 experiment. This was a result of the initial soil S levels being greater than the minimum threshold of 5.7 ppm predicted from the spring 2022 experiment. As a result of the initial high soil S levels during autumn 2022, turfgrass quality of nontreated turfgrass was acceptable. This result provides additional confidence that the turfgrass quality critical minimum S level is indeed 5.7 ppm. It should also be noted that the critical minimum is the lowest soil S concentration that would result in acceptable turfgrass but not necessarily the greatest quality. The greatest quality required additional soil S and was determined to be 8.7 ppm. Thus, if superintendents wish to maximize turfgrass quality, a minimum Mehlich-3 S level of 8.7 ppm is recommended. However, for other facilities with lower quality thresholds, 5.7 ppm Mehlich-3 S should be sufficient.
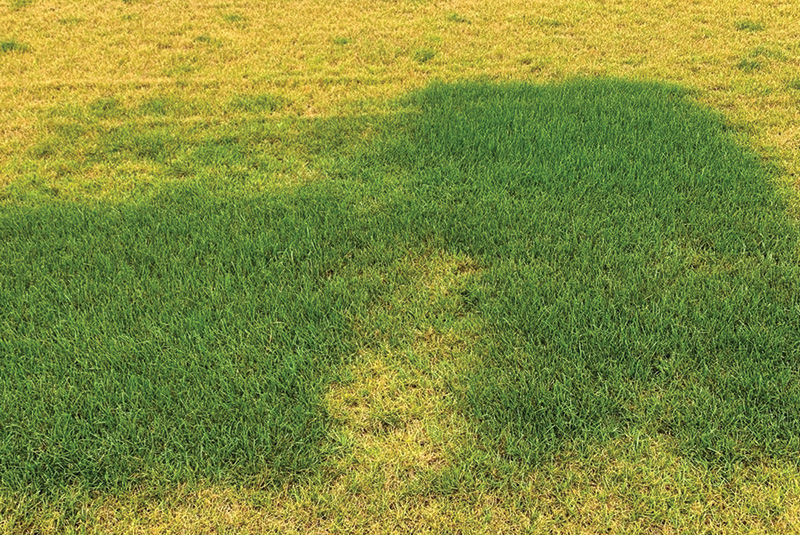
Figure 2. Kentucky bluegrass in Lexington, Ky., exhibiting sulfur deficiency. All turfgrass received 1 pound of N from urea. Only the green turfgrass received sulfur from either potassium sulfate, magnesium sulfate or calcium sulfate. Photo by Travis Shaddox
Yield and growth
Sulfur deficiency influenced not only turfgrass quality but also turfgrass growth. During the spring 2022 trial, S applied at 0.25 pounds resulted in a 4.2-fold increase in clipping yield compared to the nontreated turf (data not shown). The results also determined that for maximum clipping yield, the critical soil S range was slightly greater than that for minimum acceptable visual quality, falling between 6.1 and 8.1 ppm. However, the critical minimum for yield aligned well with the critical minimum for maximum quality (8.7 ppm).
This growth response is directly linked to plant physiology. Sulfur and N metabolic pathways are closely intertwined. When S is lacking, the plant’s ability to metabolize N is repressed, which in turn halts growth. The use of NDVI sensors confirmed this, showing that S applications increased the canopy’s greenness likely by facilitating the production of chlorophyll and S-containing amino acids like cysteine.
What about tissue testing?
In general, managing nutrients using tissue analysis is questionable due to numerous confounding factors that are often not controlled. Perhaps the greatest factor limiting tissue testing for turfgrass is the lack of correlation data supporting its use. In the current study, a correlation between tissue S and turfgrass quality was found.
Sulfur-deficient turfgrass often resulted in high leaf tissue N but remained yellow. The function of S in N metabolism helps explain this unusual condition. If leaf tissue N is above 2.4% but S is below 0.3%, the plant likely has enough N in its leaves but lacks the S necessary to metabolize that N into useful proteins. This results in an accumulation of non-protein N while the plant continues to exhibit deficiency symptoms. In such scenarios, applying more N is an inefficient use of nutrients and an unnecessary environmental risk. In other words, when N is applied in the absence of S and no response is observed, the solution is not to apply more N because N is not limiting. Instead, applying S allows the already-existing N to be metabolized, allowing turfgrass growth to increase.
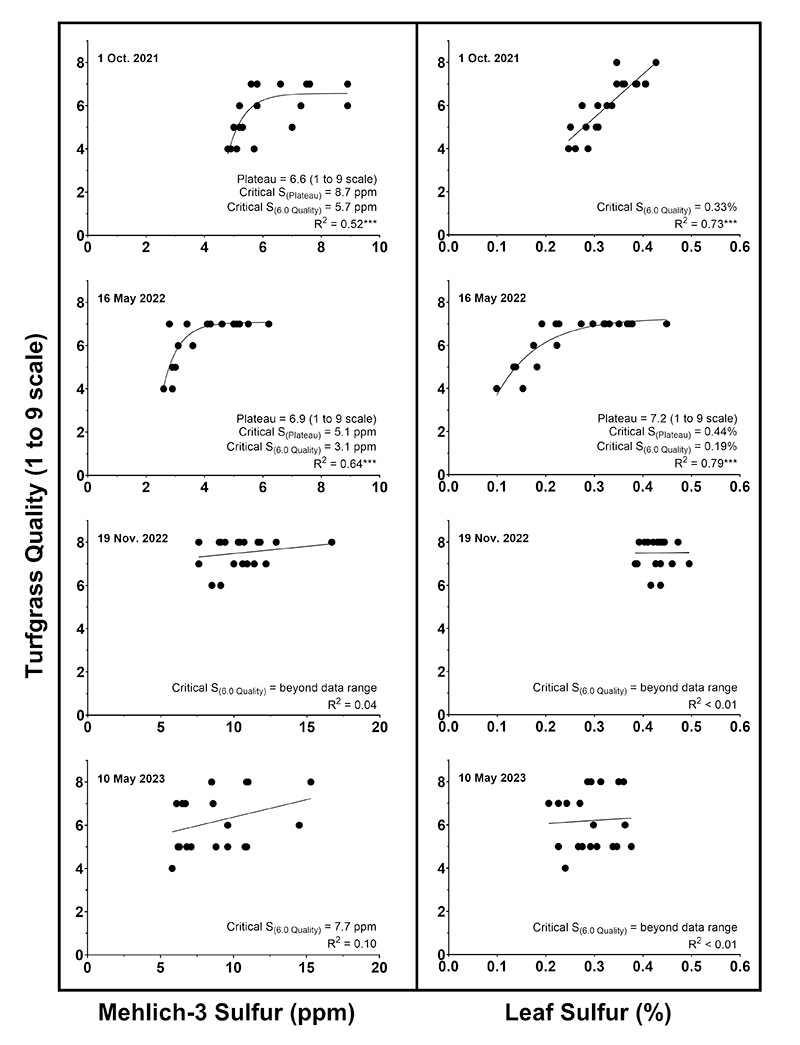
Figure 3. Relationship between Kentucky bluegrass quality and Mehlich-3 sulfur and leaf S in Lexington, Ky., from 2021 to 2023.
Soil vs. tissue testing
Tissue testing was better correlated with turfgrass response than soil testing. When turfgrass responded to applied S, tissue S resulted in an R2 (the metric that measures how well the model predicts actual data with 1 being perfect, and 0 meaning poor) between 0.73 and 0.70, whereas Mehlich-3 S resulted in an R2 between 0.52 and 0.64. The greater R2 resulting from tissue testing provides reasonable evidence that, in this case, tissue testing may be used to aid in S-deficiency diagnosis. However, tissue testing is not yet capable of predicting future deficiencies, and, for this reason, superintendents may prefer soil testing, which provides a confident prediction of how likely the application of S would result in an increase in turfgrass quality or growth.
If soil testing indicates a deficiency, how much S should you apply?
To determine how much nutrient is required to alleviate a deficiency, soil tests must be calibrated. Like the correlation results, the most useful calibration values were recovered from the first two experiments, fall 2021 and spring 2022, when initial soil S levels were low. In the spring 2022 experiment, Kentucky bluegrass receiving 0.00 and 0.08 pounds of S never achieved acceptable quality (Figure 4). However, when 0.17 pounds of S was applied, turfgrass quality increased to acceptable limits within 20 days of application. Interestingly, the two highest S rates (0.25 and 0.34 pounds per 1,000 square feet) did not result in a more rapid response, nor did they result in a greater response than S applied at 0.17 pounds. These results indicate that 0.17 pounds of S per 1,000 square feet was sufficient to alleviate the S-deficiency, and applying more S resulted in no additional benefit.
Summary
This research confirms that the Mehlich-3 soil test is a valid and effective tool for predicting S deficiency in Kentucky bluegrass. As atmospheric S levels continue to remain low, turfgrass managers should incorporate S monitoring into their standard soil testing protocols, especially when sulfate carriers (ammonium sulfate, gypsum, potassium sulfate) are not used periodically. Sulfur is not typically listed on soil test reports by default, and, therefore, superintendents may need to request S from their preferred soil testing laboratory.
The study clearly demonstrates that turfgrass growing on native soils can encounter S deficiency. A Mehlich-3 soil S test of ≤ 5.7 ppm indicates a high risk of quality reduction. Conversely, when soil S exceeds 8.4 ppm, a growth or color response to added S is unlikely. For managers dealing with deficient soils, a modest application of 0.17 pounds of S should be sufficient to alleviate symptoms.
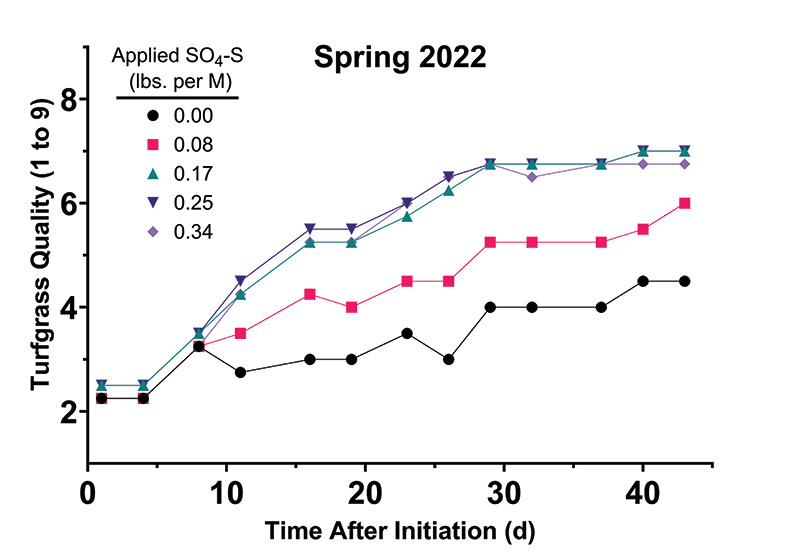
Figure 4. Quality of Kentucky bluegrass in response to increasing amounts of applied S.
Further reading
The full scientific article detailing this research, “Correlation and calibration of Mehlich-3 sulfur for Kentucky bluegrass” by T. Shaddox and D. Soldat, was published in Crop Science (2025). The study provides extensive data tables and regression analyses for those interested in more in-depth reading (https://doi.org/10.1002/csc2.70165).
The research says
- Declining atmospheric deposition has made S deficiency a significant and growing risk for turfgrass managers across the United States.
- Mehlich-3 soil S concentrations below 5.7 ppm are strongly associated with a high risk of unacceptable quality in Kentucky bluegrass.
- Maximum yield requires slightly higher soil S levels, typically in the range of 6.1 to 8.1 ppm.
- High N levels in leaf tissue cannot be effectively used by the plant if S is deficient, leading to yellowing despite heavy N fertilization.
- An application of 0.17 pounds of sulfate-S is sufficient to correct visual deficiency symptoms without the need for excessive or expensive over-fertilization.
Literature cited
- National Atmospheric Deposition Program (NRSP-3). 2022. NADP Program Office, Wisconsin State Laboratory of Hygiene, 465 Henry Mall, Madison, Wis. 53706.
- Shaddox, T.W., and D. Soldat. 2025. Correlation and calibration of Mehlich-3 sulfur for Kentucky bluegrass. Crop Science 65(5) (https://doi.org/10.1002/csc2.70165).
Travis Shaddox, Ph.D., is president of Bluegrass Art and Science LLC, Lexington, Ky. Douglas Soldat, Ph.D., is a professor, Extension specialist and department chair in the Department of Soil and Environmental Sciences at the University of Wisconsin, Madison.