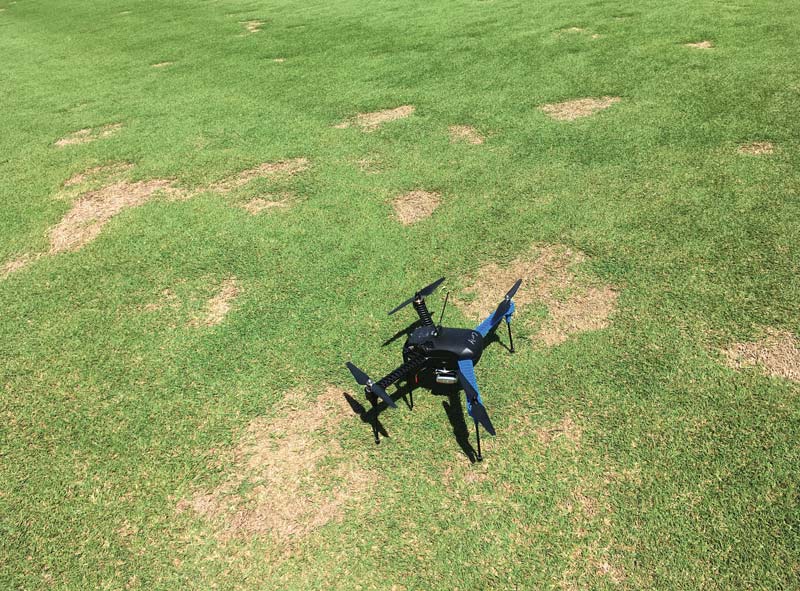
An unmanned aerial vehicle, or drone, is ready for takeoff to capture aerial imagery of spring dead spot. The blighted or dead patches of turf are symptoms of spring dead spot. Photo by Jordan Booth
Editor’s note: This research was funded in part by a grant to GCSAA from the Environmental Institute for Golf.
Spring dead spot (SDS), caused by the pathogen Ophiosphaerella species, is one of the most destructive diseases of bermudagrass exposed to cold temperatures (3). Spring dead spot infects bermudagrass, predisposing the turf to isolated patches of cold-temperature damage.
Although the primary pathogen infection occurs in the fall of the year when soil temperatures range from 50 F to 70 F (10 C to 21 C) (2), symptoms, including dead or thin patches of bermudagrass, are not present until bermudagrass exits winter dormancy in the spring of the year, and grass may take months to recover (3). Symptoms can be isolated or widespread but generally reoccur in similar geographic locations from year to year (2).
A recent survey of turfgrass managers in Virginia revealed that more than 80% of those surveyed were using chemical suppression tactics to combat spring dead spot, but that had not always been the case.
For several reasons, spring dead spot had, in general, not been chemically managed until the past 15 years. Increased demand for turfgrass quality coupled with new hybrid bermudagrasses that were slower to recover from spring dead spot symptoms prompted turfgrass managers to explore combating this disease.
Products that were labeled for spring dead spot suppression were cost-prohibitive to the majority of turfgrass managers until generic tebuconazole became available to the turf management market in 2011. At this point, it became common practice in the United States transition zone for turfgrass managers with a history of spring dead spot to make two to three applications of tebuconazole to all bermudagrass surfaces in the fall of the year.
With inconsistent results, some golf course superintendents with access to greater resources began using more-expensive QoI, SDHI or combination fungicides to suppress spring dead spot. Although this method provided more consistent control, it was certainly cost-prohibitive to many and required multiple applications of fungicides.
Turfgrass managers effectively had three chemical suppression options: apply nothing, apply an inexpensive fungicide with inconsistent results, or apply an expensive fungicide with the hope of improved control.
Site-specific spring dead spot management
With these three imperfect options, we began to explore new tactics, including site-specific management, also defined as precision turfgrass management (1). Site-specific management uses a variety of data inputs to make informed decisions on when and where to treat the turfgrass for maximum efficiency.
As in large-scale crop production, turfgrass managers worldwide are interested in ways to improve input efficiency — especially in relation to the primary cultural practices — and ways to minimize any potential negative environmental effects. An economic benefit from site-specific management is more difficult to recognize in turf than in crop production, as inputs are not balanced by crop yields in turfgrass management. Inputs are balanced by human experience, environmental benefits and aesthetics. These factors are much more difficult to quantify than revenue from harvested crops.
Spring dead spot is a prime candidate for site-specific management because of its single life cycle per year, known infection timing and geographic reoccurrence of symptoms. Our goal was to explore the option of using effective fungicides focused only in areas with disease history to effectively suppress spring dead spot while reducing inputs.
Aerial mapping
Methods were developed to document spring dead spot symptoms on bermudagrass in the spring with unmanned aerial vehicles, global positioning systems (GPS), digital imagery and global information system software.
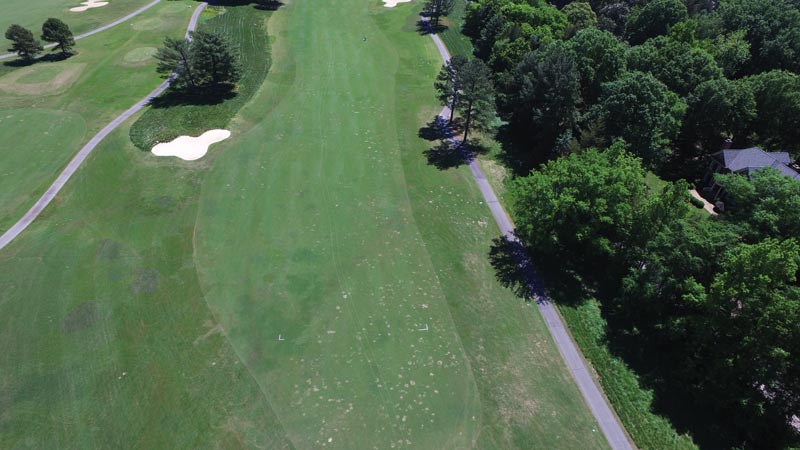
Images were stitched together, creating spatially accurate disease incidence maps to document the precise location of spring dead spot symptoms in the field. Advancements in unmanned aerial vehicle aviation, GPS accuracy and global information system software make these maps a feasible option for golf course superintendents to evaluate their golf course rapidly at a given time.
When the maps were created, patches of spring dead spot were analyzed for a digital signature compared with healthy turfgrass. Spring dead spot patches were also assigned GPS coordinates to assure accurate recognition of spring dead spot patches from overhead maps. Maps were digitally and manually analyzed using global information system software and ground-truthed digital signatures to assess spring dead spot incidence (number of patches) and area impacted by disease (% spring dead spot). This information gave us the ability to quantify spring dead spot incidence and track it between years.
Materials and methods
Research was conducted to evaluate the plausibility of site-specific management of spring dead spot from 2016 to 2018 in Richmond, Va., at The Country Club of Virginia’s Tuckahoe Creek Golf Course. The Tuckahoe Creek Golf Course maintains Vamont bermudagrass tees, fairways, roughs and approaches with a known history of spring dead spot. Multiple applications of tebuconazole had been made to the bermudagrass in the years before our study, but spring dead spot was still a common occurrence.

Advancements in unmanned aerial vehicle aviation, GPS accuracy and global information system software have made aerial maps a feasible option for superintendents to evaluate their golf course rapidly at a given time. Photo by David McCall
Aerial mapping took place in the spring of 2016, 2017 and 2018 to evaluate spring dead spot incidence and the area impacted by spring dead spot. Research plots were established across five separate Vamont fairways (locations) maintained at 0.5-inch height of cut to compare the efficacy of site-specific fungicide applications vs. blanket fungicide applications for spring dead spot suppression. Blanket fungicide applications included fungicide applications to the entire plot, and site-specific applications occurred only where disease symptoms had previously been present.
Plots were 18 feet × 20 feet (5.5 meters × 6 meters) with 20 replications of four treatments for a total of 80 plots per location. After plots had been established in the field, they were built into QGIS global information system software for analysis.
Because of the sporadic incidence of spring dead spot, plots were evaluated for disease severity and then randomly assigned one of four treatments with a known bias to evenly spread disease severity among treatments.
Site-specific applications were made only when spring dead spot symptoms had been present the previous spring.
In 2016, our methods included manual analysis of disease maps and dividing our plots into subplots representing the left, right or center boom of a sprayer. If these subplots met our spring dead spot threshold, the subplots were sprayed in our site-specific treatment. In the fall of the year, plots were re-established in the field, and subplots were flagged for application. This method was labor-intensive and not conducive to practical application.
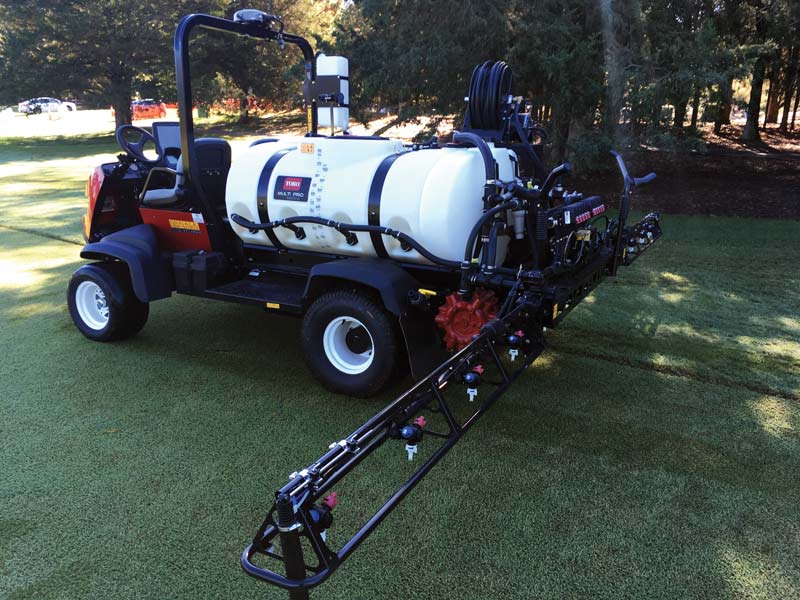
Methods were developed in 2017 to improve the automation of site-specific applications using disease incidence maps. In 2017, our methods allowed for maps, built with imagery captured by unmanned aerial vehicles, to be created and analyzed for spring dead spot symptoms in QGIS. These disease incidence maps were then turned into fungicide application maps in QGIS installed in a GPS-guided Toro Multi Pro sprayer with GeoLink, individual nozzle control and RTK correction. (Note: RTK, or real-time kinematic positioning, is a satellite navigation technique used to enhance the precision of position data derived from satellite-based positioning systems such as GPS).

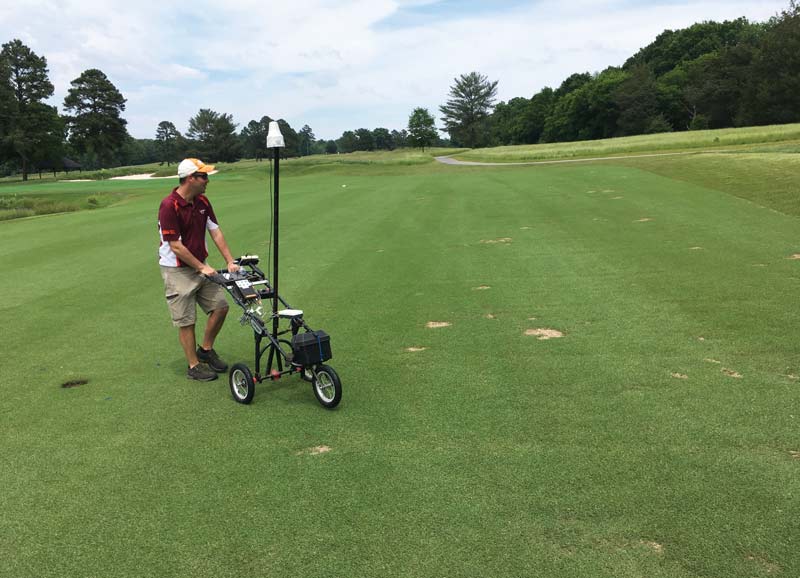
David McCall, Ph.D., records spectral and global positioning system data of spring dead spot symptoms on a Vamont bermudagrass fairway at The Country Club of Virginia in Richmond.

The sprayer used in our research to make site-specific applications in 2017 was a Toro 5800 Multi Pro sprayer with GeoLink GPS technology, individual nozzle control and RTK correction. Photos by Jordan Booth
Buffers 3.3 feet (1 meter) long were placed around every spring dead spot patch to create spray zones for our site-specific treatments. Our team simply operated the sprayer while the installed maps guided the application based on historical disease incidence. This method was also used for our blanket treatments in 2017.
Treatments were initiated in the fall of the year when soil temperatures fell below 70 F (21 C), with a second application three to four weeks after the first. The applications took place on Sept. 26, 2016; Oct. 17, 2016; Sept. 18, 2017; and Oct. 17, 2018.
Quali-Pro’s Tebuconazole 3.6F was used to represent an affordable option, whereas Velista (penthiopyrad, Syngenta) was used to represent a more expensive but more effective treatment. These fungicide applications were made at the high label rate and immediately followed by 1/8 inch (3.2 millimeters) of irrigation, with another 1/8 inch of irrigation at night. These locations were evaluated via aerial mapping the following spring for the treatments’ impact on spring dead spot suppression.
Treatments included:
- Untreated
- Tebuconazole 3.6F at 0.9 fluid ounce/1,000 square feet across the entire plot (blanket) (1.23 kilograms a.i./hectare)
- Velista at 0.7 wt. ounce/1,000 square feet across the entire plot (blanket) (2.13 kilograms a.i./hectare)
- Site-specific Velista at 0.7 wt. ounce/1,000 square feet based on disease history (2.13 kilograms a.i./hectare)
Spring dead spot incidence was reported as patch count, representing the number of spring dead spot incidence centers per plot, and as diseased area/plot (square millimeters of disease within every square meter of turf, or square millimeters/square meter), representing the area impacted by spring dead spot compared with the entire plot. Statistical analysis indicated the results for both years were significantly different, so data were separated and analyzed by each year.
Results and discussion
Our methods in 2016 resulted in a 51% reduction of fungicides used in site-specific treatments when compared with the blanket treatments. Improved automation and application techniques resulted in a 65% reduction of fungicides in 2017.
Treatment differences were observed in both years when plots were analyzed for both patch count (Table 1) and diseased area (Table 2). The results reported in 2017 represent the treatments made in 2016, and the results reported in 2018 represent the treatments made in 2017.
Overall, tebuconazole remains consistently inconsistent, as it did not outperform the untreated plots for any metric besides patch count in 2018. Blanket applications of Velista were superior to site-specific applications when analyzed for patch count. This may be a result of new spring dead spot incidence not accounted for in previous years. Site-specific applications of Velista were statistically superior to tebuconazole and equivalent to blanket applications of Velista when evaluated by diseased area.
Economic analysis
For most golf course superintendents, the biggest hurdle to implementing site-specific management of spring dead spot will be the time and cost associated with adopting these technologies. Automation and ease of site-specific management is critical to its adoption. This model may be ideal for contracted services in which superintendents hire out the aerial mapping and then make applications in-house.
Aerial mapping can provide more benefits than spring dead spot incidence alone. GPS-guided sprayers are now available from many manufacturers, but the price increase may be difficult for many superintendents to justify. Table 3 and Table 4 outline a cost estimate for our methods and equipment used during this project. These figures estimate a three-year return on the investment in GPS-guided technology when that technology is used only for the site-specific management of spring dead spot. Using this technology in other areas would accelerate the return on investment.
Conclusions
This research suggests that site-specific applications could provide control equivalent to blanket applications for reducing the area impacted by spring dead spot. Using site-specific applications could also reduce expenses over time by reducing the amount of fungicide applied to the course. Future research will focus on improving methods of site-specific management and taking this technology into the field across various golf courses and GPS-guided spraying platforms.
Funding
We would like to thank GCSAA for funding this research through a grant from the Environmental Institute for Golf. We would also like to thank the Environmental Institute for Golf and the Virginia Golf Course Superintendents Association for their financial support of this project through the EIFG Chapter Cooperative Grant.
Acknowledgments
Thanks to The Toro Co. and Syngenta Crop Protection for the use of their products during this project. Many thanks to Christian Sain, director of golf and grounds maintenance at The Country Club of Virginia, and Tuckahoe Creek Golf Course superintendent David Rathke for hosting this project.
The research says ...
- Site-specific applications of penthiopyrad were statistically superior to blanket applications of tebuconazole for SDS suppression.
- Site-specific applications were equivalent to blanket applications of penthiopyrad at reduction of SDS diseased area.
- Blanket applications were superior to site-specific applications of penthiopyrad in reducing SDS patch counts.
- Site-specific applications resulted in a 51% reduction in fungicide use in 2016 and 65% reduction in 2017.
- Return on investment of GPS-guided technology for site-specific management is estimated to be realized in three years.
Literature cited
- Carrow, R.N., J.M. Krum, I. Flitcroft and V. Cline. 2010. Precision turfgrass management: Challenges and field applications for mapping turfgrass soil and stress. Precision Agriculture 11(2):115-134.
- Smiley, R.W., P.H. Dernoeden and B.B. Clarke. 2005. Compendium of Turfgrass Diseases. 3rd edition. American Phytopathological Society, St. Paul, Minn.
- Tredway, L.P., M. Tomaso-Peterson, H. Perry and N.R. Walker. 2009. Spring dead spot of bermudagrass: A challenge for researchers and turfgrass managers. Plant Health Progress 10(1):32.
- Walker, N.R., T. Mitchell, A. Morton and S. Marek. 2006. Influence of temperature and time of year on colonization of bermudagrass roots by Ophiosphaerella herpotricha. Plant Disease 90:1326-30.
Jordan Booth, CGCS, is based in Richmond, Va., as a research associate for Virginia Tech and is pursuing his doctorate while managing research and extension responsibilities in central Virginia. David McCall is an assistant professor and extension specialist in the School of Plant and Environmental Sciences at Virginia Tech in Blacksburg, Va. Dana Sullivan is co-owner and president of TurfScout LLC in Greensboro, N.C.