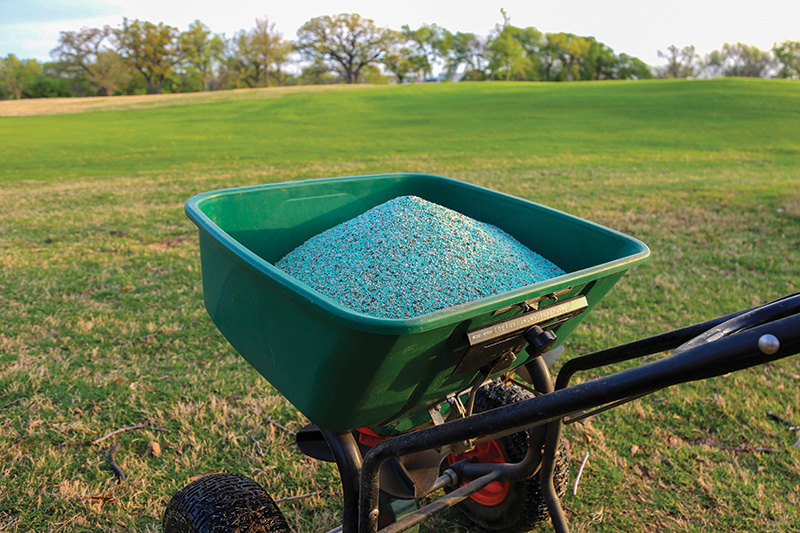
Soil testing is an important part of turfgrass management, but which nutrient recommendation guidelines you follow can have a big impact on how much fertilizer you apply. USGA photo
Editor's note: This article is reprinted with permission from the June 20, 2025, issue of the USGA Green Section Record. Copyright USGA. All rights reserved. The original article can be accessed here.
Throughout my entire turfgrass management career, until recently, I have always followed the traditional nutrient recommendations when interpreting soil tests or planning fertilizer applications. The wonderful collection of superintendents and academics I worked for over the years followed the same nutrient recommendations, and by my standard they were all successful. By default, that meant that in order for me to be successful, I should follow their methods without question. It now appears to me to be a classic case of the blind authority fallacy. My current role as an Extension agent at the University of Delaware affords me the opportunity to investigate other methods of assessing soil-nutrient status and potentially better ways to determine the amount of nutrients turfgrass systems really need. Before diving into the results from a recent soil sampling campaign and study, it’s important to tell the story of how my approach to soil nutrient recommendations evolved, as a superintendent and now as a researcher. We will also briefly review some common soil-test interpretation methods.
Reconsidering traditional nutrient recommendations
I began working on a golf course in the summer of 2000. Since then, it is nearly impossible to estimate the number of times or the quantity of phosphorus (P), potassium (K), calcium (Ca) and magnesium (Mg) I have applied to turfgrasses. However, I can tell you the number of times I have seen turfgrass respond to those applied nutrients. That number is one — one instance where a P deficiency was observed, and symptoms were quickly alleviated with a fertilizer application. I have never seen a K, Ca or Mg deficiency in any turfgrass system except on a research putting green or in a greenhouse where the condition was created by design. To my knowledge, there has never been a documented case of a Ca deficiency in turf except in hydroponics. To quickly recap, tons of fertilizer applied over 25 years using traditional recommendations and only a single unique case where applying one of these nutrients resulted in a positive response by the grass.
On a golf course, there is always more to be done than the maintenance team has time for. Yet there I was, religiously applying these nutrients, especially K and Ca, multiple times per year simply because the recommendations said so and not because I was seeing any beneficial impact. As I reflect, it seems to me that the recommendations I was following made me a less-efficient turfgrass manager.
I am confident that my personal anecdotes are not unique. Nevertheless, the point of my story is to highlight how traditional nutrient recommendations have been handed down decade after decade, and we continue to follow them even when there is little or no evidence to justify their use. Are traditional recommendations wrong? Not necessarily, because applying fertilizer by way of the traditional interpretation methods undoubtedly supplies the grass with ample amounts of nutrients. Are these recommendations broken? That may be too strong of a descriptor, but they definitely aren’t efficient or accurate, and as every turfgrass manager knows, operational efficiency is the key. A great example of this conundrum is when Gelertner et al. (2) and Shaddox et al. (5) showed that those who soil test and use traditional recommendations apply more nutrients than those who don’t.
The Minimal Levels for Sustainable Nutrition (MLSN) approach was first introduced to me in 2018. My take-home message was that I could apply much less fertilizer without compromising turfgrass quality, and that stuck with me. I must admit that I didn’t fully understand how to practically use MLSN at first, but I was intrigued. Later, I found myself constantly thinking about the MLSN idea, as it was so different from the way I was taught in my undergraduate studies and how my mentors applied fertilizer. In 2020, I left the golf course management industry and moved into a turfgrass Extension role at the University of Delaware. My new position afforded me the opportunity to pursue graduate studies. After diving into the scientific literature on turfgrass nutrient management, it became clear to me the body of work around MLSN needed to be expanded. With funding from the USGA, I initiated work on developing Delaware-specific nutrient guidelines using similar methods from Woods et al. (8) and comparing them to the current MLSN guidelines.
In the turfgrass management industry, there are three methods laboratories typically use to interpret the results of a soil test — Sufficiency Levels of Available Nutrients (SLAN), Base Cation Saturation Ratios (BCSR) and MLSN. I will only cover SLAN and MLSN, as the BCSR method has little scientific merit to support its use (1, 3). Saturated paste extracts (SPE) have had some popularity as well, but this method should only be used for assessing soil salinity and sodium hazard. SPE is not a valid testing method to determine macronutrient needs.
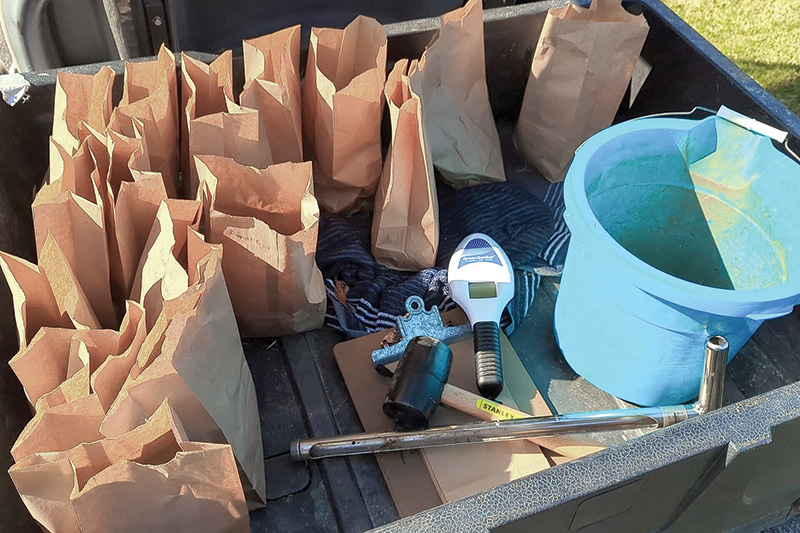
Hundreds of soil samples were collected and analyzed from golf courses, athletic fields and lawns across Delaware as part of this study.
MLSN
First introduced in 2012, MLSN was a joint effort between Larry Stowell, Ph.D., and Wendy Gelernter, Ph.D., formerly of PACE Turf, and Micah Woods, Ph.D., of the Asian Turfgrass Center. Both organizations had large databases of soil test results from all over the world. To develop the first MLSN guidelines, they combined the two datasets (16,163 samples), then filtered the data by pH (5.5 to 8.5) and cation exchange capacity (CEC) (less than or equal to 6.0 cmolc per kg). The CEC is the amount of positive charge that can be exchanged per given mass of soil. It essentially quantifies the soil’s ability to hold nutrients and is usually measured in centimoles of charge per kilogram (cmolc per kg). They then graphed the distribution of each element and identified the concentration that corresponded to 90% of samples having good turf quality. The ensuing values became the MLSN guidelines. For example, let’s look at the MLSN guideline for P, which is 21 parts per million (ppm). Ninety percent of the samples in the dataset are producing good-performing turf with a concentration of 21 ppm (Mehlich 3) or greater. These guidelines are essentially a concentration of nutrients in the soil that you do not want to go below. Although, there is a 10% buffer built into the guidelines because 10% of the samples in the dataset are still producing good-performing turf below the MLSN guideline of 21 ppm. When developing MLSN guidelines, the samples are analyzed to determine the nutrient concentrations associated with acceptable turf quality. The lowest nutrient level that still supports good turf is identified, and the MLSN minimum is then set 10% above that value to provide a safety margin.
The MLSN dataset is large and contains many different species of grass and soil types from around the world. While MLSN as an interpretation method is generally accepted as sound, there has been industry and academic pushback to the assertion of MLSN working for all turfgrasses on all soils. Soil testing is not, and likely never will be, perfect. We must concede to the fact that we cannot perform traditional soil test calibrations for every soil type and every species, much less every cultivar of a species. This is summed up well by Thompson et al. (7), who eloquently state that, “because calibration data does not exist for all turfgrass species on all soils … concessions are inevitable.”
SLAN
The SLAN interpretation method assumes that there is an “ideal” or “sufficient” range for the concentration of each nutrient, whereas MLSN simply says not to allow the soil concentration of the nutrient to drop below a given level. Soil test reports using SLAN will categorize the concentration of each nutrient. The categories will be some version of “high” “medium” or “low” and may vary slightly from lab to lab. For example, the University of Delaware Soil Testing Lab (UDSTL) (https://www.udel.edu/canr/cooperative-extension/environmental-stewardship/soil-testing/) uses the categories “low,” “medium,” “optimum” or “excessive” — where “low” is interpreted as having a high probability of a favorable plant response to applied fertilizer, “medium” has a low to moderate probability of a favorable plant response, “optimum” is unlikely to respond to applied fertilizer, and “excessive” is when the soil nutrient concentration is more than adequate for plant growth and further applications will be uneconomical and may have undesirable effects on plant growth or the environment (6). Fertilizer recommendations will decrease as the soil test nutrient concentration approaches the “optimum” category. No fertilizer will typically be recommended if categorized as “optimum” and will never be recommended if levels are considered “excessive.”
The basic idea of SLAN is to apply fertilizer until the soil concentration is considered “optimum.” There are three flaws I see with SLAN. First, the SLAN interpretation method has slowly evolved from the agricultural sector, where yield and economics are the driving parameters for determining fertilizer needs. Applying fertilizer to achieve maximum yield is wasteful, potentially detrimental and mostly irrelevant in turfgrass systems. Second, turfgrass systems are judged on quality and performance. The MLSN dataset along with the data from this study are contemporary refutations concerning the relative level of nutrients needed to produce high-quality, good-performing turf. Third, the soil test calibration data that supposedly supports the SLAN method does not exist or was done on crops other than turfgrasses. Frankly speaking, SLAN can overestimate the amount of fertilizer required to grow high-quality turfgrass.
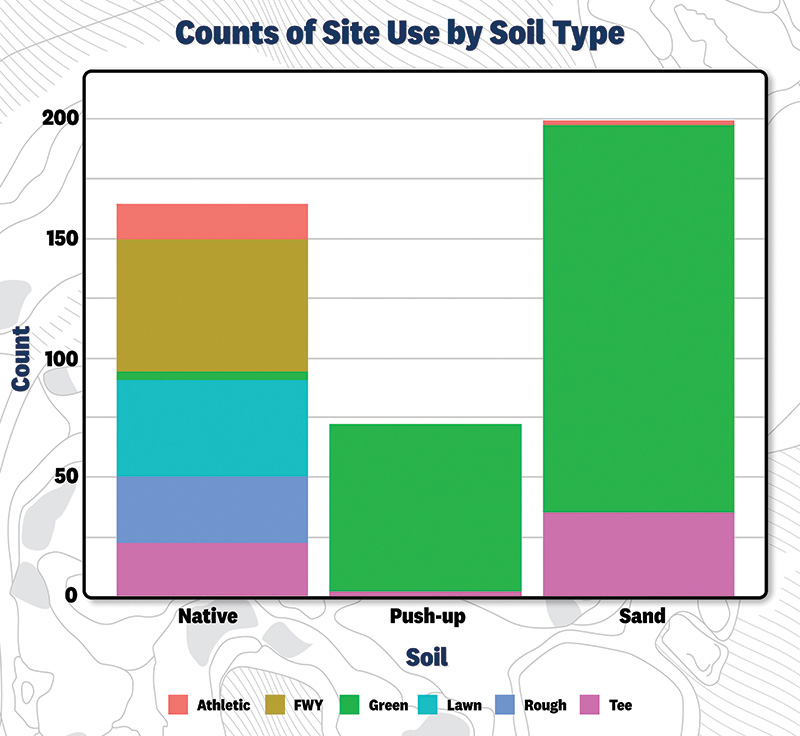
Figure 1. The breakdown of samples in the study by site use and soil root zone type. The majority of putting greens tested were sand-based, while tees were almost evenly split between native soil and sand-based root zones. All fairways sampled in this study were native soil.
Developing MSLN guidelines for turfgrass systems in Delaware
Materials and methods
A soil sampling campaign of the turfgrass systems in Delaware began in May of 2023 and was completed in June of 2024. All soil samples were taken from various turfgrass stands throughout the state. Sites that were sampled included golf courses (236 putting greens, 55 fairways, 59 tees, 28 roughs), 17 athletic fields, and 40 lawns or parks. All soil cores were taken from a depth of 4.0 inches (10 centimeters) using an industry standard soil probe with an inside diameter of 0.75 inch (1.9 centimeters). For each defined turfgrass sward (green, fairway, lawn, etc.), regardless of the total area, 12 cores were collected, mixed in a plastic pail and composited to form one sample to be submitted to the lab. The entire core was left intact, including the verdure, and combined with the composited sample. The composited sample was labeled and placed in a brown paper bag. All soil samples were left to sit in an open paper bag to air dry until arrival at the soil testing lab.
All soil samples were taken from turf that at the time of sampling was healthy, vigorous, had no visual symptoms of nutrient deficiencies and would be expected to perform well under its intended use and management regimen. The majority of samples were given a turfgrass quality (TQ) score at the time of sampling of either an A, B or C using a modified rating scale similar to what is used by the National Turfgrass Evaluation Program. The NTEP TQ scale ranges from 1 to 9, where 9 is outstanding or ideal turf and 1 is the poorest or dead turf. TQ scores used in this research can be further clarified using the following scale: A = turfgrass quality cannot be improved and is considered exceptional for the corresponding use and would be equivalent to an NTEP rating of 8 or 9; B = turfgrass quality is very good, but the turf could be improved to an A with minimal effort and would be equivalent to an NTEP rating of 7 or 8; C = turfgrass quality is still good and could be easily improved and would be equivalent to an NTEP score of 6 or 7. In this study, 107 samples had a TQ rating of A, 217 were rated a B, 57 were C, and 54 were NA.
Sample analysis
Soil samples were submitted to the University of Delaware Soil Testing Lab for analysis. Once at the lab, soil samples were dried then ground and sieved in preparation for nutrient extraction. Organic matter was analyzed by the loss on ignition method using a muffle furnace temperature of 360 F (182 C). The soil pH was determined using a 1:1 soil-to-water method. The concentrations of P, K, Ca, Mg and sulfur (S) were measured by inductively coupled atomic plasma emission spectroscopy following extraction using the Mehlich-3 method.
Metadata
Other metadata collected for each sampling site consisted of the site name, GPS coordinates, physical address, sampling date, site use (green, tee, fairway, rough, lawn or athletic field), soil root zone type (native soil, sand-based root zone or push-up), predominant species of grass, the predominant soil series as identified by the Natural Resources Conservation Service Web Soil Survey (4) and if clippings were collected or not. For this study, a push-up green is considered a native soil green that has been topdressed with sand for many years and likely has an appreciable clay content that results in an increased CEC and water-holding capacity. The use for much of this metadata is currently unclear, but as we further refine our methods of data analysis for these types of projects, this information may be useful in fine-tuning nutrient recommendations (Figure 1).
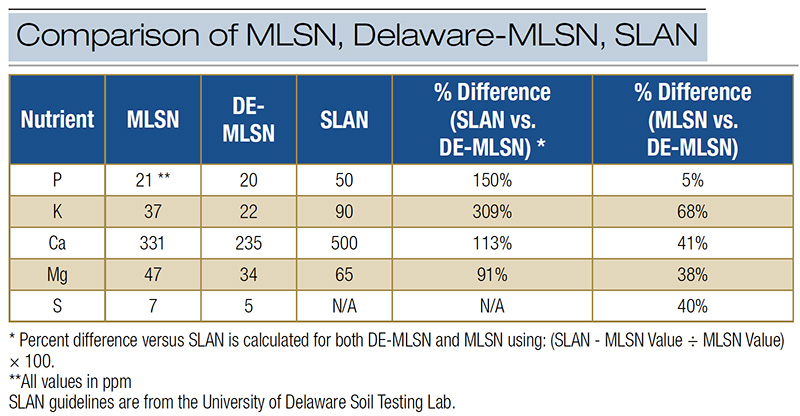
Table 1. The results of this study suggest that regional adjustments can be made to broader MLSN guidelines that reduce unnecessary nutrient applications while still maintaining good-performing turfgrass. When compared to traditional SLAN guidelines, the difference in nutrient recommendations with MLSN and DE-MLSN guidelines is significant.
Statistical analysis
The methods of statistical analysis used to calculate what we will call the Delaware-MLSN (DE-MLSN) guidelines are the same as those outlined by Woods previously (8). To briefly summarize, this dataset of samples (n = 435) was filtered by pH and CEC. The pH filter includes the samples with a value ranging from 5.5 to 8.0, and the CEC filter includes all samples with a CEC less than or equal to 6.0 cmolc kg or less. Filtering the dataset by pH essentially avoids including samples that could experience aluminum or alkalinity toxicities. As for the CEC filter, the idea is that if we identify the soils that have a low nutrient supplying power (low CEC) while supporting good-performing turf, it is logical to expect a soil with a CEC above 6.0 cmolc kg to be equally capable of supplying the grass with sufficient nutrients. Once the dataset was filtered by pH and CEC (n = 288), the distribution of the samples for each element was graphed using the Tidyverse package (ggplot) in RStudio. The value designated as the DE-MLSN guideline is the individual nutrient concentration of each element that corresponds to the 10% probability on the distribution curve.
Practical application of the results for turf managers
A key consideration for the practical use of the DE-MLSN guidelines is that they are only valid for the state of Delaware. Although, the Delmarva Peninsula soil type is predominantly Atlantic Coastal Plain, so these guidelines would likely be valid for use on most of the peninsula, which, as the name implies, includes parts of Delaware, Maryland and Virginia. However, more regional sampling would be required to justify this claim.
The DE-MLSN guidelines for P, K, Ca, Mg and S are 20, 22, 235, 34 and 5 ppm, respectively. After hosting seminars on the topic of MLSN and the preliminary results of my work, I have had turfgrass managers approach me and state that they feel these MLSN guidelines are too low. Yet, if you grow turfgrass in Delaware, the data presented here suggests that MLSN is too high. The DE-MLSN guidelines range from 5% to 68% less than the MLSN guidelines, but they are between 91% to 309% lower than the traditional SLAN recommendations of the UDSTL (Table 1). The UDSTL uses SLAN guidelines that are fairly consistent with those of other reputable labs around the nation.
The dataset contained a fairly even mix of turfgrasses grown in sand-based root zones (including push-up surfaces with high sand content) and native soil — 199 and 236 samples, respectively. Those 236 sand-based samples came from putting greens, while 199 came from all other site uses. Putting greens dominated the portion of samples with a sand-based root zone, while the remaining site uses came from a soil with significant clay content. One aspect of the dataset that may be of concern is the disparity in number of samples per site. Due to varying levels of access, there were some locations that contained 20 or more samples and other sites with two or three. There are statistical analysis methods to address sample weighting, and I intend to explore whether this concern has a significant impact on the resulting DE-MLSN guidelines.
One aspect of the data that jumped out was the DE-MLSN values for Ca and Mg. These two elements were 41% and 38% less than the MLSN guidelines, respectively. It is not clear why this is the case for the samples, but it is possible that the native soils of Delaware have some amount of Ca- and Mg-bearing minerals that provide a slow-release source of nutrients.
Final thoughts on nutrient recommendations and deficiencies
To me, it is evident that traditional recommendations using the SLAN methods are antiquated and inefficient, and that MLSN is a great starting point for anyone looking to use an improved approach to nutrient management. The differences in DE-MLSN and the standard MLSN recommendation point to the value in developing MLSN recommendations for specific areas. The turf industry will benefit from more local and regional soil testing data that is collected and statistically analyzed in a similar manner to this study. It is important that the work to improve nutrient recommendations doesn’t stop here. The more robust of a dataset we have, the more accurate and useful our nutrient recommendations become.
Finally, there is an elephant in the room that I want to address — nutrient deficiencies. There has been a lot of fearmongering in the turfgrass industry on this topic since, well, forever. Let me be clear — you will not wake up tomorrow, arrive at work, and all the turf is dead due to a nutrient deficiency. This is not how it works. Nutrient-deficiency symptoms come on slowly over days and weeks. If you see your turf regularly, as golf course managers do, you will have plenty of time to respond before a decline in quality that is worrisome. If you are armed with soil test reports, you can make some basic calculations to ensure that you apply enough fertilizer to avoid nutrient deficiencies. The key is to apply as little as possible while avoiding issues. What I describe in this article is, in my opinion, the modern method of turfgrass nutrient management: applying only what the grass needs, nothing more. Anything more is a waste of your time, your money, your energy and your mental health. Golf course superintendents and other turfgrass managers have enough to worry about without adding imaginary nutrient deficiencies to the list.
The research says
- Following traditional soil test recommendations often leads to applying more nutrients than turfgrass needs.
- Minimum levels for sustainable nutrition is an approach to managing soil nutrient levels such that nutrient inputs and costs are reduced, while still maintaining desired levels of turf quality and playability.
- There is opportunity to improve on general MLSN recommendations by creating region-specific versions.
- Researchers analyzed hundreds of soil samples from across Delaware and correlated them with turf quality and other metrics to develop MLSN recommendations for the state of Delaware.
- Compared to traditional sufficiency level of available nutrient recommendations, the Delaware MLSN recommendations suggest that maintaining 150% less phosphorus, 309% less potassium, 113% less calcium, and 91% less magnesium in the soil is sufficient and will have no negative impact on turf quality.
- Furthermore, the Delaware-specific MLSN guidelines suggest maintaining 5% less phosphorus, 68% less potassium, 41% less calcium, 38% less magnesium and 40% less sulfur than general MLSN recommendations.
Literature cited
- Culman S.W., C. Brock, D. Doohan, D. Jackson-Smith, C. Herms, V.N. Chaganti, M. Kleinhenz, C.D. Sprunger and J. Spargo. 2021. Base cation saturation ratios vs. sufficiency level of nutrients: A false dichotomy in practice. Agronomy Journal 113:5623-5634 (https://doi.org/10.1002/agj2.20787).
- Gelernter, W.D., L.J. Stowell, M.E. Johnson and C.D. Brown. 2016. Documenting trends in nutrient use and conservation practices on U.S. golf courses. Crop, Forage & Turfgrass Management 2:1-10 (https://doi.org/10.2134/cftm2015.0225).
- Kopittke, P.M., and N.W. Menzies. 2007. A review of the use of the basic cation saturation ratio and the “ideal” soil. Soil Science Society of America Journal 71(1):259-265.
- NRCS, Soil Survey Staff. 2024. Natural Resources Conservation Service, United States Department of Agriculture. Web Soil Survey (https://websoilsurvey.nrcs.usda.gov/app/).
- Shaddox, T.W., J.B. Unruh, M.E. Johnson, C.D. Brown and G. Stacey. 2023. Nutrient use and management practices on United States golf courses. HortTechnology 33(1):79-97 (https://doi.org/10.21273/HORTTECH05118-22).
- Sims, J.T., and K.L. Gartley. 2001. University of Delaware Soil Test Note 1. University of Delaware. (https://www.udel.edu/content/dam/udelImages/canr/pdfs/extension/factsheets/stnote01.pdf).
- Thompson, C., E. Guertal, P. McGroary, D. Soldat and B. Hopkins. 2023. Considerations with soil testing in turfgrass. In: M. Fidanza, ed. Achieving sustainable turfgrass management.
- Woods, M.S., L.J. Stowell and W.D. Gelernter. 2016. Minimum soil nutrient guidelines for turfgrass developed from Mehlich 3 soil test results. (No. e2144v1). PeerJ Preprints.
John Emerson Jr. is a turfgrass Extension agent at the University of Delaware, Newark.