Traffic stop: By maximizing the number of hole locations on a green, foot traffic — which can cause a decline in the playing surface — gets dispersed. Photo by Montana Pritchard
Let’s be honest: Does anyone out there think there aren’t enough numbers available to them for properly managing their greens?
We live in a day and age in which root-zone moisture, salinity and temperature are available at the push of a button; in which firmness of putting surfaces and the amount of sunlight reaching them can both be quantified; in which miniature helicopters outfitted with infrared cameras can be flown over the entire course to collect a multitude of data points. These days, a superintendent’s toolbox looks more like it was borrowed from James Bond than Old Tom Morris. Yet at some point, even 007 might have to ask, “What do we do with all of these measurements? How do we translate all of these numbers into actions?”
The reality of greenkeeping today is, there’s no shortage of numbers out there. Yes, all of these sophisticated measurement devices come with a price tag, but they are available. With golf course technology, the current limitations aren’t so much about what we can measure, but rather how we can best use all the measurements.
One of the greatest and perhaps most often overlooked aspects to these conversations about technology is that we don’t necessarily need more devices producing more measurements — we need better systems for navigating the vast sea of data we already have. We need technology that builds a bridge from the numbers we have to the actions we need to take. This installment of “What the Tech?” explores how we can bring different types of information together so that the numbers can “talk to each other” when important decisions have to be made.
Pin placement: Playability meets plant health
Superintendents operate at the crossroads of (some might say, “in the crosshairs of”) plant health and playability. Striking a proper balance between these dual — and at times competing — interests requires not only information that speaks to both, but the ability to consider and address both at the same time. Maximizing playability today without compromising the long-term health of the greens in the future is a challenge that exists every day a course is open for play.
One intriguing option for addressing this ever-present challenge is pin placement software. Different products are available, but one we’ve talked about for the past few years in our “Gadgets & Gizmos” seminar at the Golf Industry Show is ezLocator.
While it may seem a bit out of place to include something as mundane as pin placement in a column dedicated to cutting-edge technology, ezLocator has infused this routine task with some powerful, automated capabilities that very much speak to the demands of both plant health and playability. What this software and other systems like it ultimately give superintendents isn’t just more numbers to sift through, but rather options for how they want to set up their course. Playability can be dialed-in with increased precision, and, at the same time, putting green health can be preserved and protected.
Better decision-making and record keeping
Key benefits of pin placement software are flexibility, communication and record keeping.
Flexibility stems from the fact that automated hole locations are merely suggestions; the final decision still resides with the superintendent. And after the pin placements have been selected, that’s not the end of the process — it’s more like the middle of it. Each day’s hole locations become the basis for generating pin sheets that can be further communicated (via smartphone or printed copy) to maintenance staff, the pro shop and golfers. Each hole location is also recorded, so it can be factored in when making future decisions.
What these software programs aim to do is maximize the number of hole locations for each green, leading to unique and more challenging and enjoyable experiences for golfers, while also promoting turfgrass health by reducing excessive wear and repetitive traffic. (Really good information is available from Hathaway and Nikolai [2005], if you’re interested in taking a deeper dive into foot traffic near hole locations.)

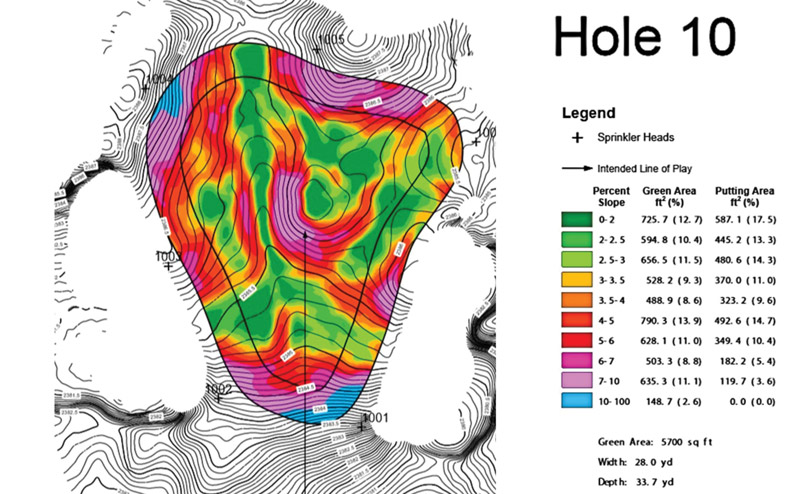
Figure 1. A contour map of a putting green along with measurements and statistics, generated by ezLocator.

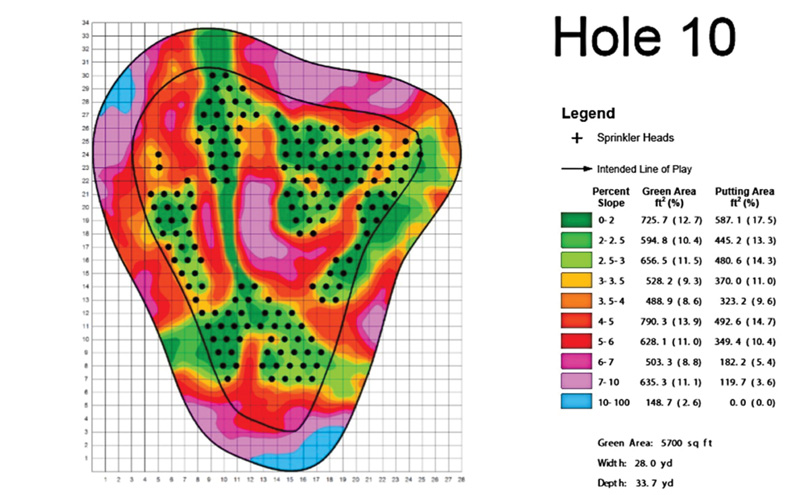
Figure 2. A map of all possible hole locations that meet slope requirements and additional input criteria, generated by ezLocator.
What stands out about ezLocator are the maps it generates for each green (Figure 1, above). Color-coded contour and slope maps of each putting surface are the foundation on which other pieces of information are laid. By precisely understanding the slope and contours of each green, the software can objectively and systematically identify hole locations that satisfy the additional criteria put forward by golf course personnel.
Superintendents, tournament directors or other decision-makers are able to tell the program what they do and don’t want in terms of hole locations — how challenging they want the putts to be (incorporating Stimpmeter measurements), how close pins can be to the edge of the green, areas within the green that need to be avoided (and for how long), how close pins can be to previous hole locations, and how long they want to wait until revisiting previously used hole locations.
All of this can ultimately be used to produce a map that displays all available options for acceptable pin locations (Figure 2, above). After a location has been selected, that information is shared and recorded. So, what started out as a map has now become a database that serves as a decision-making aid, communication tool and record-keeping system.
Crunching the numbers
The impressive maps that ezLocator produces do come at a cost. Slope analysis of each green is required to create these maps, leading to a greater first-year cost for ezLocator services. After the initial mapping cost has been met, annual renewal costs are considerably less.
For those who like the idea of automated hole locations but need to avoid some of the higher initial costs, ezPins is available as a “value-priced” alternative. This web-based application allows courses to manage hole locations using much of the same input criteria as ezLocator, again producing maps for superintendents and pin sheets for golfers.
Another pin placement software product on the market, from DPP Golf, also emphasizes features such as precise pin locations, the protection of areas within a green, tracking hole locations, and generating pin sheets.
To try to bring all of this full circle: When these different pin placement systems mention “protecting specific areas within a green,” what does that mean to you? Within that phrase is a ton of potential for using information already being collected by other measurement devices — moisture meters, drone photos, firmness meters, light measurements, etc. Pin placement software programs become a new avenue for that information to find its way into daily course setup. As these different numbers become part of the larger greens maintenance conversation, we aren’t left with some new, arbitrary and ambiguous number, but rather a tangible action that seeks to affect both playability and plant health in the best possible way.
The most impressive part of this is that such software allows a wide array of numbers to become part of the decision-making process while still leaving room for the superintendent to have the final say. Simply put, these programs speak to both the art and science of greenkeeping, and any technology worth its salt will always need to do that.
Reference
Hathaway, A.D., and T.A. Nikolai. 2005. A putting green traffic methodology for research applications established by in situ modeling. International Turfgrass Society Annex — Technical Paper 10:69-70.
Daniel O’Brien is a former program technician, Mike Richardson is a professor, and Doug Karcher is a turfgrass soil specialist and professor in the Department of Horticulture at the University of Arkansas in Fayetteville, Ark.