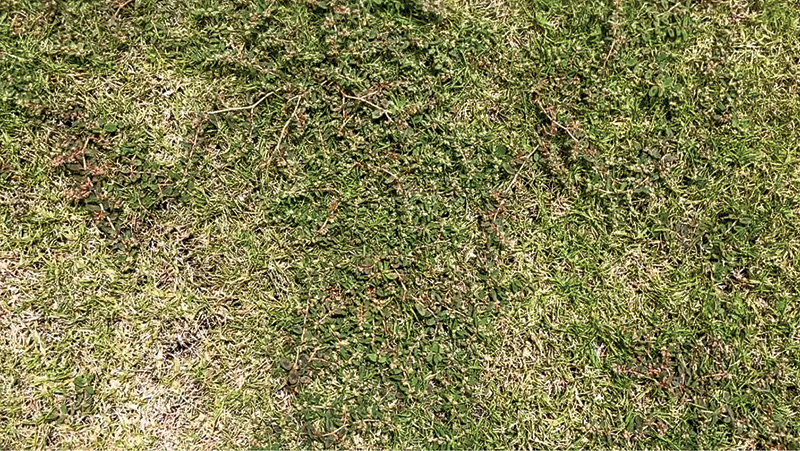
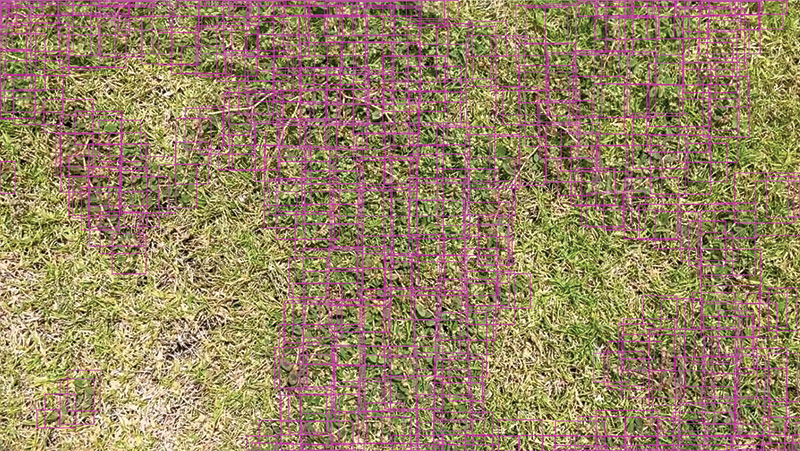
Figure 1. Original still-frame image with spotted spurge infestation in bermudagrass turf (A) and same image manually labeled using “bounding boxes” drawn around the outer margins of individual target plants or their parts used for YOLOv3 model training (B). Photo by Pawel Petelewicz
When controlling emerged weeds, golf course superintendents must rely heavily on broadcasting the entire area with herbicides, despite the nonuniform pattern of typical weed infestations (7, 8, 18). Such broadcast applications result in a portion of the
product deposited to turfgrass canopy in the absence of the weed, which is considered wasteful (10). Site-specific weed management (SSWM) — manual spot applications directly to individual weeds in particular — minimize herbicide losses
but are labor intensive and often cost prohibitive (5, 13). Moreover, such an approach often lacks sufficient accuracy and precision due to human error (17, 18, 19, 20).
Deep learning (DL), a subset of artificial intelligence, can bring the best of those worlds together and enable precise herbicide deposition to spatially and temporally variable weed infestations (10). The DL is based upon the utility of convolutional
neural networks (CNNs), the algorithms that can decipher grid-structured spatial relationships for automated learning of informative features (3, 6). Machine vision (MV) is the process of signal transfer from a sensing device (e.g., image-capturing
camera) into a digital form (11). Paired with MV, CNNs have the potential for recognition of certain objects within an image (3, 6) to be used for automated differentiation between weeds and turf (2, 4, 8, 14, 15).
CNNs were first introduced for ground-level weed recognition in turfgrass by University of Florida (UF/IFAS) researchers (20). Initially, the focus was on image classification (img-class) networks, which indicate whether the target weed is present in
the image but cannot precisely point to it (7, 8, 17, 18, 19, 20). In contrast, object detection (obj-det) models offer superior performance by precisely locating the weed within the image (9, 17, 19, 20). To date, weed recognition with obj-det models
was achieved primarily by leveraging the contrast between the target and background, either through color differentiation, such as detecting green weeds in dormant turf (19, 20), or by utilizing shape and texture differences of distinct clumps of
broadleaf weeds within fine-leafed turfgrass canopy (9, 17). In many cases, however, weeds blend with turf, posing challenges for recognition models.
The factual accuracy and precision of a targeted spraying system are dependent not only on the performance of its CNN component, but also on the capacity of the application device to target the weed and avoid the crop. In real-world scenarios, an application
pattern created by an individual nozzle in motion will be a linear strip of varying width (bandwidth) depending on the nozzle height and orifice angle (16). As bandwidth increases, more area is covered, so the ability to precisely target small areas
is limited compared to narrower bandwidths. Therefore, multiple nozzles comprising multiple narrow bandwidths should increase the precision and accuracy of the sprayer, because each nozzle can be operated independently to cover a smaller area (8,
16). However, identifying the proper nozzle density for a turfgrass-specific precision sprayer is crucial to achieve the compromise between maximized precision and accuracy and minimum installation and maintenance costs.
Therefore, there were two primary objectives within the scope of our research. The first objective was to develop an obj-det model using state-of-the-art You Only Look Once (YOLO) CNN to detect complex spotted spurge patches structurally blended within
highly infested bermudagrass turf maintained as a golf course fairway/athletic field. The second objective was to evaluate the impact of various nozzle densities on the YOLO CNN model efficacy and projected herbicide savings under simulated conditions.
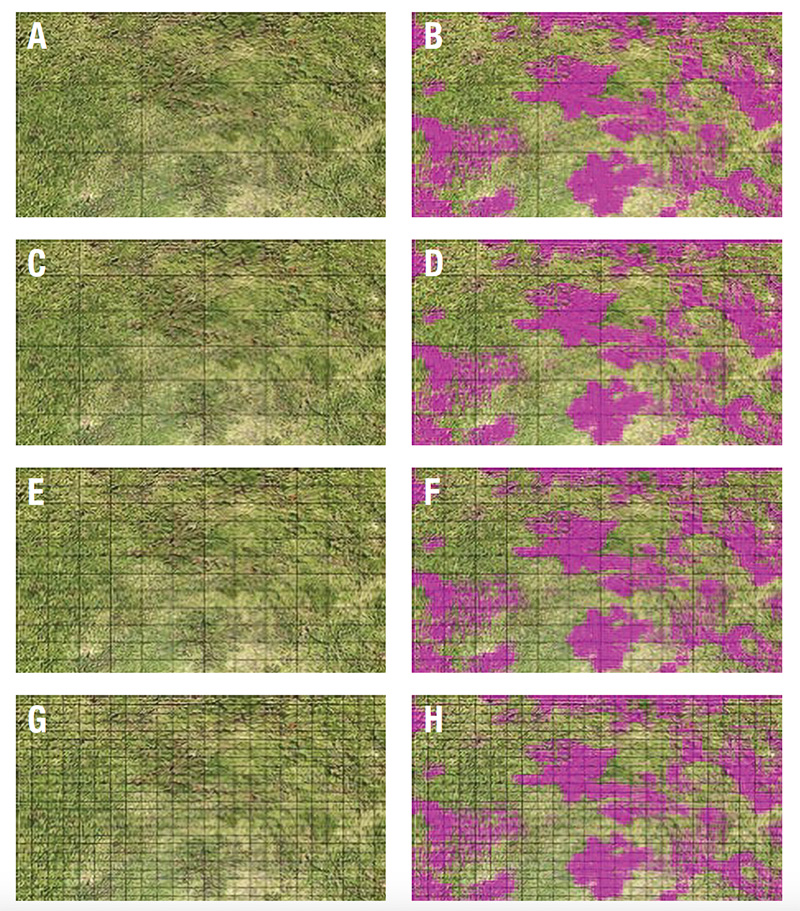
Figure 2. Original input image (left column – A, C, E, G) and same image with YOLOv3-generated "bounding box" spotted spurge predictions (right column – B, D, F, H) with 3 × 3 (A, B), 6 × 6 (C, D) 12 × 12 (E, F), and 24 × 24 (G, H) grid matrixes demonstrating respectively three, six, 12 or 24 nozzles equally distributed on the spraying boom.
Materials and methods
Image acquisition
To ensure a diverse dataset, images of various levels of spotted spurge infestation in Latitude 36 bermudagrass managed as a golf course fairway were collected at various times from March to July 2021 from two locations: UF/IFAS Fort Lauderdale Research
and Education Center in Davie and at the UF/IFAS Plant Science Research and Education Unit in Citra. Still images were captured using a cellphone camera (iPhone 8 Plus, Apple Inc., Cupertino, Calif.) via recording videos in MOV file format using 16:9
ratio and subsequently extracting individual frames using FFmpeg (Free Software Foundation Inc., Boston) script at four frames per second with pixel resolution of 1280 × 720. The camera was installed facing downward at a fixed height of 17 inches
(43 centimeters). The ground area represented in the recordings was 20 inches (50 centimeters) (typical broadcast nozzle spacing) × 11 inches (28 centimeters). The acquired images were subjectively selected to ensure balanced representation
of captured weed encroachment levels, lighting conditions and turfgrass canopy quality resulting in a total of 1,291 images for further model development/training and simulation.
Model development
A randomly selected subset of 710 of the extracted still-frame images was labeled using bounding box drawing software compiled with Lazarus 1.8.0 (www.lazarus-ide.org/) to identify spotted spurge in turfgrass. Labeling consisted of a rectangle (“bounding
box”) drawn around the outer margins of individual spotted spurge plants or their parts on the background of turfgrass canopy in each image (Figure 1). The labeled subset of images was then used to train a YOLOv3-tiny-3l model. The trained model
was then used to identify and auto-label spurge in randomly selected 481 unlabeled images. Subsequently, a final model was trained with a combined dataset of 1,191 labeled images consisting of both 710 manually and 481 auto-labeled images using previously
fine-tuned hyper-parameters (i.e., configuration variables to manage model training).
Model accuracy assessment
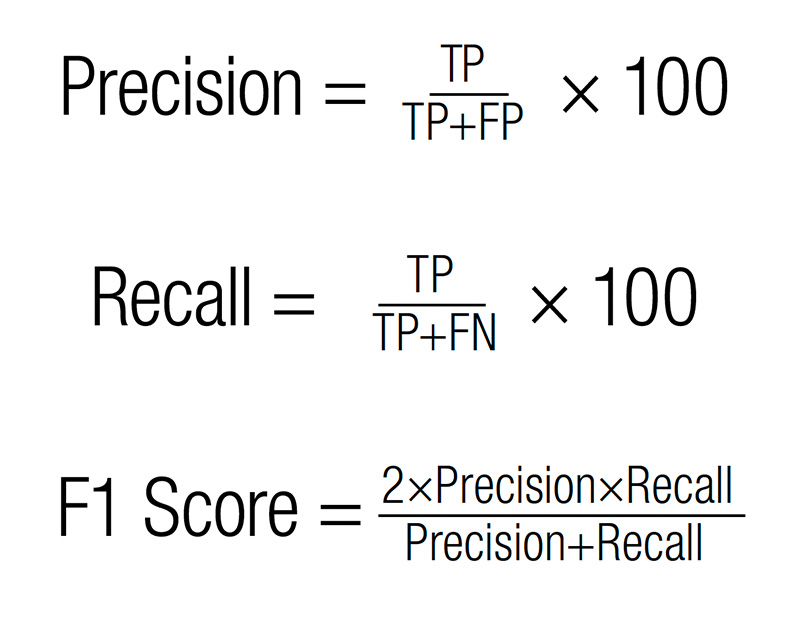
Intersection over Union (IoU) was used to describe the ratio of overlap between the actual and predicted bounding boxes to establish if the detected object (spotted spurge) was a true positive (TP), false positive (FP), true negative (TN) or false negative
(FN). Upon the completion of CNN training, these parameters were utilized to compute precision (17, 19, 20) and recall (17, 19, 20), which were further used to compute the overall model’s performance metric: F1 Score (7, 8, 17, 19, 20) according
to the equations below.
Model efficiency assessment under simulated varying nozzle densities
The remaining 100 unlabeled images were predicted with the trained YOLO model, and 50 output images (i.e., images labeled by our final YOLO model) were randomly selected for analysis. Each image was evaluated using a series of grids with a 3 × 3,
6 × 6, 12 × 12 and 24 × 24 matrix to simulate three, six, 12 or 24 nozzles respectively, equally distributed on the spraying boom to cover the bandwidth of 20 inches total (Figure 2). This simulation was conducted under the assumptions
that each individual nozzle remains open for the same time interval, the pattern and distribution is even and equal for each nozzle, and spray patterns do not overlap; thus, the ratio of the sprayed area remains the same. Grids were created on separate
layers in Adobe Photoshop (Adobe Inc. 1988) and individually placed over each of the YOLO-labeled images. This step created four new files per image and resulted in a total of 200 gridded labeled files for evaluation. The dimensions of each individual
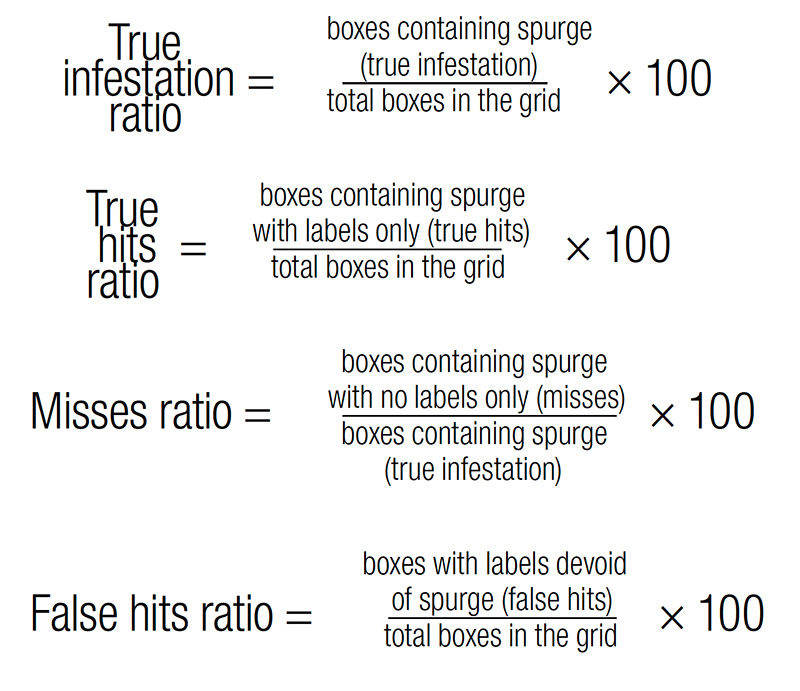
box within each grid matrix scenario were calculated based on actual total surface area captured in the photos (Table 1). The following data was manually collected for each grid-labeled file: 1) the number of grid boxes containing spurge regardless
of detection (i.e., regardless, if labeled with bounding boxes; true infestation); 2) number of grid boxes containing bounding box-labeled (i.e., detected) spurge only (true hits); 3) number of grid boxes containing bounding box-labels devoid of spurge
(false hits); and 4) number of grid boxes with spurge that was not labeled with bounding boxes (misses). This information was used to calculate the following variables for each grid:
Data analysis
Each of 50 photos was considered a separate experimental unit, grids considered fixed variables, and images considered random variables. Analysis of variance was performed using the Proc Mixed procedure in SAS (version 9.4; SAS Institute, Cary, N.C.)
and means for each fixed variable were compared using Tukey Means Comparisons at alpha = 0.05. Nonlinear regression was conducted in Sigma Plot (Systat Software Inc., San Jose, Calif.), and an exponential decay model was used to predict the relationship
between the dependent variables listed above and the number of boxes in the grid for each grid pattern:
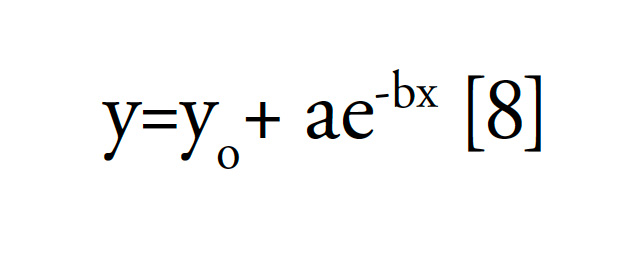
where y is the dependent variable, yo is the starting point, a is the scaling factor, e is the natural log and -b is the rate of decay at box number x.
Results and discussion
Spotted spurge detection
The majority of prior ground-level weed-recognition work in turfgrass focused primarily on img-class algorithms (7, 8, 18, 19, 20), and obj-det models have not been studied to the same extent. However, in those few researched cases, obj-det models not
only provided weeds’ exact location but demonstrated superior performance compared to img-class as denoted by higher F1 scores (19, 20). The F1 score is a widely used measure of models’ performance. In general, when the F1 score is >0.50,
the model’s performance is considered sufficient (i.e., the detection is successful), while the maximum value of 1.00 indicates its perfect fit/maximum performance (1, 21). All this limited existing work on obj-det in turfgrass has focused on
identifying weeds against contrasting backgrounds (9, 19, 20). In our research, the focus was on a more complex scenario in which the target weed was structurally blended within the turfgrass canopy as opposed to forming easily distinguishable clumps
(either by color or shape).
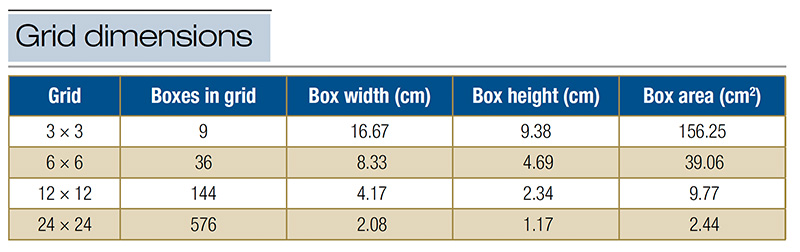
Table 1. Calculated grid dimensions for each photo of spotted spurge in Latitude 36 bermudagrass turf.
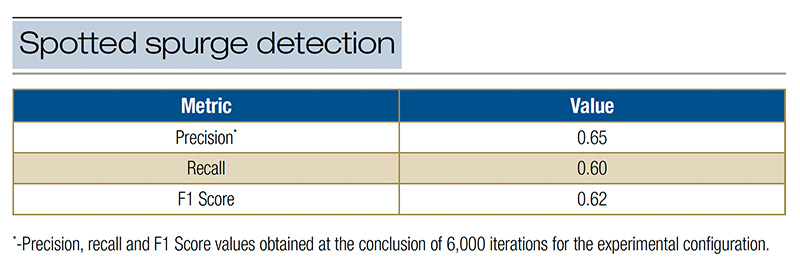
Table 2. Spotted spurge detection in Latitude 36 bermudagrass training results using You Only Look Once (YOLO) real-time multi-object detection algorithm. Images for model development acquired from UF/IFAS Plant Science Research and Education Unit in Citra and UF/IFAS Fort Lauderdale Research and Education Center in Davie.
However, the overarching purpose for our obj-det model was to achieve sufficient performance allowing for evaluating its potential to cooperate with various nozzle density settings. For this objective to be met, the minimum of 0.50 score in all the evaluated
metrics (i.e., precision, recall, F1 score) was required. For the above-described purposes, we chose to employ the currently most widely used obj-det YOLO model. Despite being trained on a modest number of images, i.e., <1,200, compared to 16,000
to 36,000 required for some img-class models (19), our model accomplished spotted spurge detection as denoted by precision of 0.65, recall of 0.60 and finally F1 Score of 0.62 — i.e., all metrics >0.50 (Table 2). Therefore, the minimum requirement
was considered fulfilled, and our study is the first report of the successful recognition of diversified and complex weed patches formed by spotted spurge and intertwined in actively growing bermudagrass turf maintained as a golf course fairway using
obj-det algorithm.
This was possible due to the weed annotation (i.e., labeling) approach that we followed in which instead of labeling the entire plant with a single bounding box, the small parts of the plant (i.e., partial annotation) were labeled using multiple boxes
(14). However, the improvements of our model’s performance to enable it to achieve fitness levels close to perfection (i.e., F1 Score of 1.00) are needed before deploying it in the field and will be the subject of further research. To achieve
this, the focus will be on methods allowing us to expedite the currently time- and labor-intensive dataset preparation process.
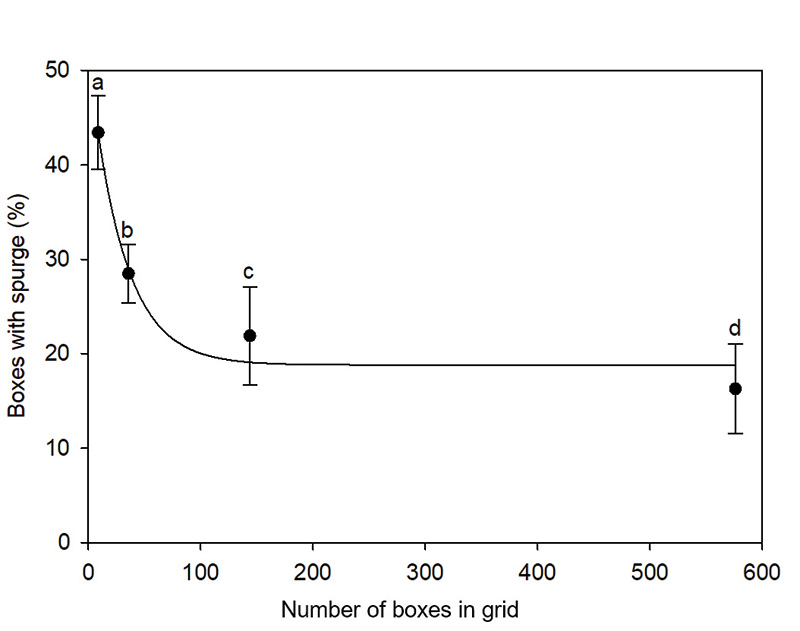
Figure 3. True infestation ratio, i.e., the percentage of boxes containing spotted spurge regardless of detection (i.e., regardless, if labeled with bounding boxes; true infestation), at four box densities within a grid pattern. The error bars are the standard error of the mean (n = 50). Means marked with the same letter are not statistically different at P ≤ 0.05.
Effects of grid density on spotted spurge detection
An efficient MV-based weed detection system is the foundation for the success of a targeted sprayer. However, to maximize the benefits of such technology, a sprayer needs to be capable of delivering herbicide to the detected target as accurately and precisely
as possible (8). While obj-det algorithms enable precise weed localization (9, 19, 20), the accuracy and precision of herbicide deposition to target plants is dependent on actuator characteristics (16). Research proves that in the case of small weed
patches dispersed across the field, sprayed bandwidth should be minimized, and either independently operated nozzles or narrow boom sections are necessary to attain significant herbicide reduction (12, 16). Our study examined potential herbicide savings
offered by turfgrass-specific targeted spraying technology using grid-matrix simulation of various nozzle density scenarios. Grids were utilized to estimate herbicide use at different nozzle densities, with an increase in nozzle density corresponding
to a decrease in spray width (Table 1).
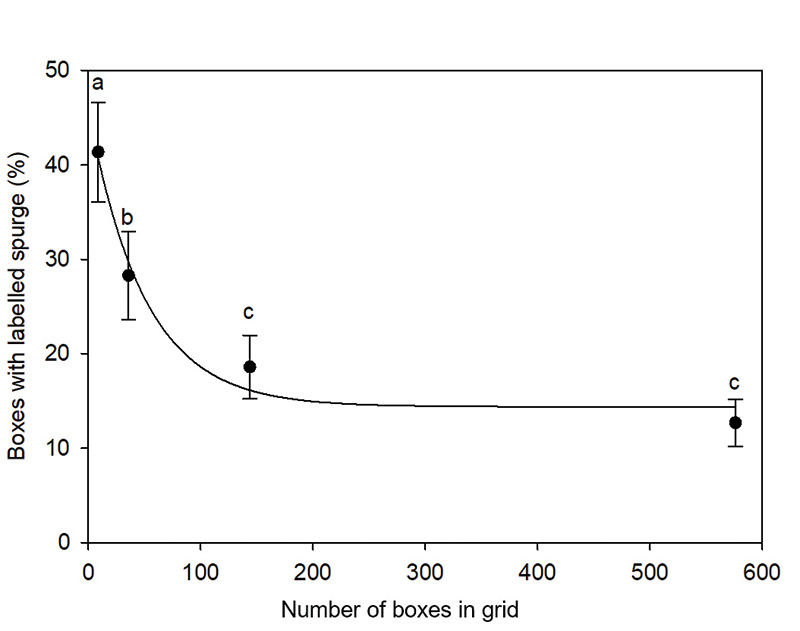
Figure 4. True hits ratio, i.e., the percentage of boxes containing spotted spurge with labels only (true hits) at four box densities within a grid pattern. The error bars are the standard error of the mean (n = 50). Means marked with the same letter are not statistically different at P ≤ 0.05.
True infestation ratio and true hits ratio, which provides an estimate of detection accuracy, followed a similar pattern of exponential decline as the number of boxes in the grid increased (Figures 3 and 4). Results indicate that when a system sprays
only those areas where spotted spurge is present, then three nozzles would spray 41% of the area, and increasing to six, 12 and 24 nozzles would further decrease the area sprayed to 28%, 18% and 13% respectively. This translates to 59%, 72%, 82% and
87% in herbicide savings compared to broadcast application, respectively (Figure 4).
Moreover, the YOLO model we used resulted in few misses, i.e., non-detected spurge (Figure 5), but a greater number of false hits was observed (Figure 6). Results were significantly higher with the 3 × 3 and 6 × 6 grids due to the higher probability
of unlabeled spurge occurring within the larger boxes. Higher grid densities (12 × 12 and 24 × 24) provided significantly fewer false hits (both <5%).
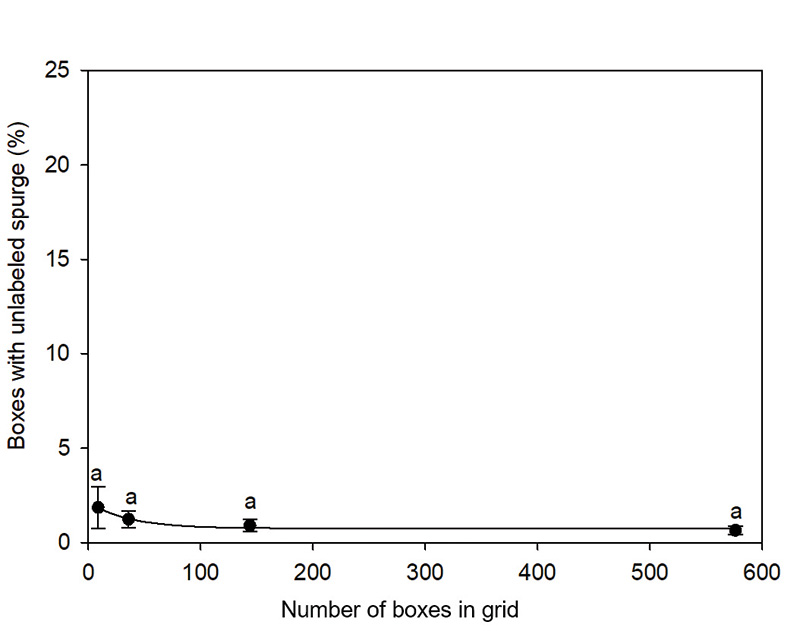
Figure 5. Misses ratio, i.e., the percentage of boxes containing spotted spurge with no labels only (misses) at four box densities within a grid pattern. The error bars are the standard error of the mean (n = 50). Means marked with the same letter are not statistically different at P ≤ 0.05.
Overall, higher nozzle density provided better accuracy and greater herbicide reduction, while at the same time significantly improved accuracy resulting in a further reduction in herbicide losses from misplacement to nontarget areas. Those results align
with research in other crop settings (12, 16). However, the difference in savings offered by 12- and 24-nozzle scenarios was not statistically significant (Figure 4). The increase in the number of nozzles on the spraying section increases equipment
and maintenance costs. Thus, based on the results, optimal herbicide savings (~80% reduction in herbicide use compared to broadcast) would occur with 12 nozzles applying a 1.64-inch (4.17-centimeter) band. However, it is important to note that the
large mats of spotted spurge captured in this research represented high encroachment levels. Therefore, potential savings may increase further when targeting lower infestations. The spray deposition uniformity within the bandwidth with minimal overlap
seems key to maintaining good coverage while ensuring the goal of maximizing efficiency. Optimizing the spraying section configuration to achieve such narrow bandwidths along with verification of cost-benefit relationships of added costs and maintenance
(increased nozzles and valve actuators) versus herbicide cost savings will be a subject of future research with prototype sprayers.
Figure 6. False hits ratio, i.e., the percentage of boxes with labels devoid of spotted spurge (false hits) at four box densities within a grid pattern. The error bars are the standard error of the mean (n = 50). Means marked with the same letter are not statistically different at P ≤ 0.05.
The research says
- In addition to identifying weeds against contrasting backgrounds, the real-time obj-det models can be employed to recognize and locate complex weed structures blending within turfgrass canopy for turfgrass-specific ground-based targeted application
systems.
- Effective development of future weed recognition models for turfgrass is going to be highly dependent on expediting data preparation protocols.
- As demonstrated in our simulation, the potential herbicide savings from a turfgrass-specific targeted sprayer could reach up to ~80% compared to broadcast application, contingent upon the infestation level. Given that our research scenario depicted
high encroachment levels, it is conceivable that with lower infestations, the potential herbicide savings could be even greater.
- Using our turf/weed model as a basis, optimal actuator efficacy and herbicide savings would occur by increasing nozzle density from one to 12 nozzles within the context of a single band.
Literature cited
- Allwright, S. 2022. What is a good F1 score and how do I interpret it? (http://stephenallwright.com/good-f1-score/). Accessed Sept. 15, 2023.
- Esau, T., Q. Zaman, D. Groulx, K. Corscadden, Y. Chang, A.W. Schumann and P. Havard. 2016. Economic analysis for smart sprayer application in wild blueberry fields. Precision Agriculture 17:753-765 (https://doi.org/10.1007/s11119-016-9447-8).
- Greener, J.G., S.M. Kandathil, L. Moffat and D.T. Jones. 2022. A guide to machine learning for biologists. Nature Reviews Molecular Cell Biology 23:40-55 (https://www.nature.com/articles/s41580-021-00407-0).
- Hasan, A.S.M.M., F. Sohel, D. Diepeveen, H. Laga and M.G.K. Jones. 2021. A survey of deep learning techniques for weed detection from images. arXiv (https://doi.org/10.48550/arXiv.2103.01415).
- Heisel, T., C. Andreasen and A.K. Ersbøll. 1996. Annual weed distributions can be mapped with kriging. Weed Research 36(4):325-337 (https://doi.org/10.1111/j.1365-3180.1996.tb01663.x).
- Janiesch, C., P. Zschech and K. Heinrich. 2021. Machine learning and deep learning. Electronic Markets 31:685-695 (https://doi.org/10.1007/s12525-021-00475-2).
- Jin, X., M.V. Bagavathiannan, A. Maity, Y. Chen and J. Yu. 2022a. Deep learning for detecting herbicide weed control spectrum in turfgrass. Plant Methods 18:94 (https://doi.org/10.1186/s13007-022-00929-4).
- Jin, X., M.V. Bagavathiannan, P.E. McCullough, Y. Chen and J. Yu. 2022b. A deep learning-based method for classification, detection, and localization of weeds in turfgrass. Pest Management Science 78(11):4809-4821 (https://doi.org/10.1002/ps.7102).
- Medrano, R. 2021. Feasibility of real-time weed detection in turfgrass on an Edge device. M.S. dissertation. California State University, Channel Islands.
- Monteiro, A., and S. Santos. 2022. Sustainable approach to weed management: The role of precision weed management. Agronomy 12(1):118 (https://doi.org/10.3390/agronomy12010118).
- Nasirahmadi, A., S.A. Edwards and B. Sturm. 2017. Implementation of machine vision for detecting behaviour of cattle and pigs. Livestock Science 202:25-38 (https://doi.org/10.1016/j.livsci.2017.05.014).
- Rasmussen, J., S. Azim, J. Nielsen, B.F. Mikkelsen, R. Hørfarter and S. Christensen. 2020. A new method to estimate the spatial elation between planned and actual patch spraying of herbicides. Precision Agriculture 21:713-728 (https://doi.org/10.1007/s11119-019-09691-5).
- Rider, T.W., J.W. Vogel, J.A. Dille, K.C. Dhuyvetter and T.L. Kastens. 2006. An economic evaluation of site-specific herbicide application. Precision Agriculture 7(6):379-392 (https://doi.org/10.1007/s11119-006-9012-y).
- Sharpe, S.M., A.W. Schumann and N.S. Boyd. 2020. Goosegrass detection in strawberry and tomato using a convolutional neural network. Scientific Reports 10(1):9548 (https://doi.org/10.1038/s41598-020-66505-9).
- Thorp, K.R., and L.F. Tian. 2004. A review on remote sensing of weeds in agriculture. Precision Agriculture 5:477-508 (https://doi.org/10.1007/s11119-004-5321-1).
- Villette, S., T. Maillot, J.P. Guillemin and J.P. Douzals. 2021. Simulation-aided study of herbicide patch spraying: Influence of spraying features and weed spatial distributions. Computers and Electronics in Agriculture 182:105981 (https://doi.org/10.1016/j.compag.2020.105981).
- Yu, J., A.W. Schumann, Z. Cao, S.M. Sharpe and N.S. Boyd. 2019a. Weed detection in perennial ryegrass with deep learning convolutional neural network. Frontiers in Plant Science 10:1422 (https://doi.org/10.3389/fpls.2019.01422).
- Yu, J., A.W. Schumann, S.M. Sharpe, X. Li and N.S. Boyd. 2020. Detection of grassy weeds in bermudagrass with deep convolutional neural networks. Weed Science 68(5):545-552 (https://doi.org/10.1017/wsc.2020.46).
- Yu, J., S.M. Sharpe, A.W. Schumann and N.S. Boyd. 2019b. Deep learning for image-based weed detection in turfgrass. European Journal of Agronomy 104:78-84 (https://doi.org/10.1016/j.eja.2019.01.004).
- Yu, J., S.M. Sharpe, A.W. Schumann and N.S. Boyd. 2019c. Detection of broadleaf weeds growing in turfgrass with convolutional neural networks. Pest Management Science 75(8): 2211-2218 (https://doi.org/10.1002/ps.5349).
- Zhao, L., and S. Li. 2020. Object detection algorithm on improved YOLOv3. Electronics 9(3):537 (https://doi.org/10.3390/electronics9030537).
Paweł Petelewicz (petelewicz.pawel@ufl.edu) is an assistant professor of turfgrass weed science and Gregory E. MacDonald is a professor of weed science, both in the Agronomy Department at the University of Florida (UF/IFAS), Gainesville; Qiyu Zhou is
an assistant professor of turfgrass management in the Crop and Soil Sciences Department at North Carolina State University, Raleigh, and a former postdoctoral associate at the UF/IFAS, Gainesville; Marco Schiavon is an assistant professor of turfgrass
science in the Environmental Horticulture Department at the UF/IFAS Fort Lauderdale Research and Education Center, Davie; Arnold W. Schumann is a professor in the Department of Soil, Water and Ecosystem Sciences at the UF/IFAS Citrus Research and
Education Center, Lake Alfred; and Nathan S. Boyd is a professor of weed and horticulture sciences in the Department of Horticulture and an associate center director at the UF/IFAS Gulf Coast Research and Education Center, Wimauma.