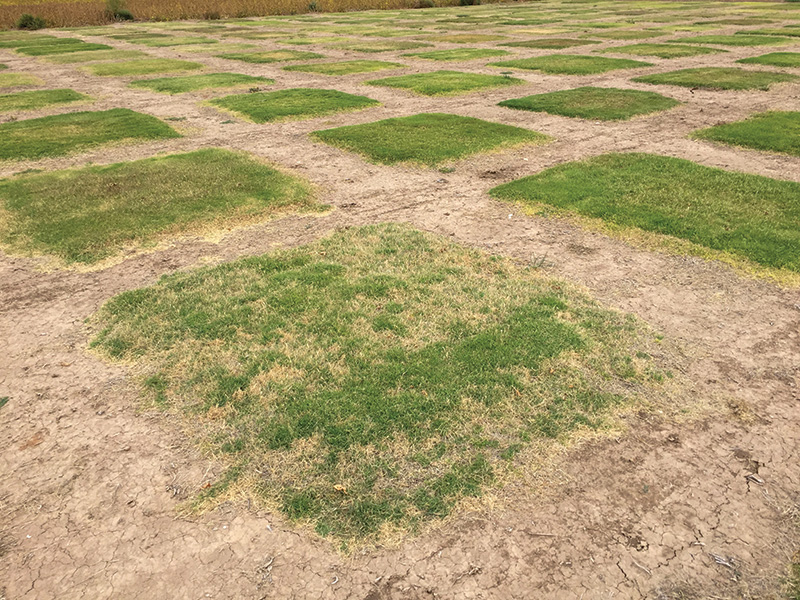
Figure 1. The turf-type bermudagrass population showed marked variation in drought response in early October of 2018. Photos by Shuhao Yu
Bermudagrass is susceptible to winterkill in transition zone climates (15). Winterkill typically results in substantial expense to a facility due to the direct cost of reestablishing turf and loss of revenue for an extended period. Use of winter-hardy
bermudagrasses and implementation of best management practices (BMPs) are the most effective way to alleviate winterkill. Since the 1960s, researchers at Oklahoma State University have collected bermudagrass germplasm from around the world to conduct
biosystematics investigation and genetic research (7). Some of this collection and additional germplasm collected and developed have been used in developing bermudagrass cultivars with improved winter survivability, such as Patriot, Latitude 36, NorthBridge
and Tahoma 31.
Bermudagrass winter hardiness is determined by its freeze tolerance and influenced by environmental factors and management practices. Controlled-environment experiments have been used to estimate the lethal freezing temperature to reach 50% mortality
(LT50) of bermudagrass (1). The space limitations of these chambers have thus far been a barrier to achieving high-throughput screening of large populations for freezing tolerance. Field trials have also been widely used to evaluate spring green-up
(i.e., post-winter dormancy regrowth in spring), which is significantly negatively correlated with winterkill and thus a good proxy for winter survivability (16). Prior reports have shown substantial variation in spring green-up in common bermudagrass
(13), African bermudagrass (9) and hybrid bermudagrass (17).
As urban and suburban areas expand, large areas of previously nonirrigated lands are being converted to irrigated lawns and landscapes. The increasing irrigation demand has exacerbated water scarcity issues, especially in summer. The use of drought-resistant
turfgrass species and cultivars is a sound management strategy for water conservation (3). Variation in drought resistance among bermudagrass cultivars has been demonstrated in previous studies. For example, Steinke et al. (14) reported Celebration
bermudagrass had the best drought response for green cover maintenance and took more than 50 days to decrease to 50% green cover. Yu found TifTuf bermudagrass maintained 90% green cover after 72 days of acute drought stress, whereas Tifway only had
34% (18).
Turfgrass consumers in the transition zone need new turf-type bermudagrass cultivars that combine high visual quality, sufficient winter hardiness and improved drought resistance. Evaluating breeding materials for multiple traits in separate trials requires
extra time and resources. Conducting a field trial targeting multiple traits is common for most breeding programs. However, assessing drought response and winter survivability has not been previously reported concurrently in the same trial for turf-type
bermudagrasses. Understanding the magnitude of genetic factors in phenotypic expression is critical for breeders to select appropriate breeding and selection strategies (6). Broad-sense heritability (H2) is the proportion of genetic variance contributing
to total observed phenotypic variation. Similarly, reliability (i2) estimates the proportion of the genetic factor in phenotypic expression with testing materials from different breeding backgrounds compared to the heritability estimates that only
apply to a population with known parents (2). Knowing the respective genetic contribution of drought response and spring green-up (SG) evaluated in the same trial would increase understanding of how they interact within bermudagrasses and provide
strategic information for selecting breeding materials with multiple traits in future bermudagrass improvements. Therefore, the objectives of this study were to concurrently evaluate winter survivability and drought response for turf-type bermudagrass
experimental genotypes and to investigate the potential effects between SG and drought response in turf-type bermudagrasses.
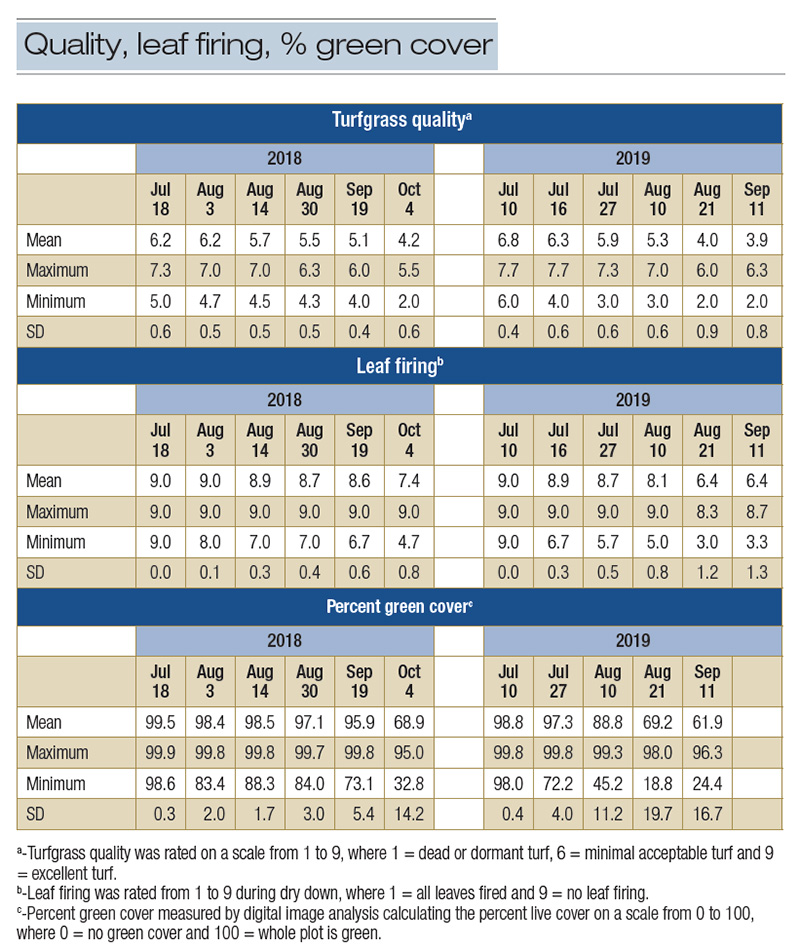
Table 1. Means, ranges and standard deviations for mean turfgrass quality, leaf firing, percent green cover and canopy temperature of 84 bermudagrass genotypes.
Material and methods
Eighty-four bermudagrass genotypes — 77 experimental selections and seven cultivars (Astro, Latitude 36, Northbridge, Tahoma 31, TifTuf, Tifway and U3) — were planted in a field trial at OSU Panhandle Research and Extension Center in Goodwell,
Okla., on June 28, 2017. The site has an average summer (June-August) monthly rainfall of 2.2 inches (5.6 centimeters) and an average annual low temperature of 19 F (minus 7 C) (11). The experimental design was a randomized complete block with three
replications. The plot size was 6 feet x 6 feet (1.8 meters x 1.8 meters) with 3 feet (0.91 meters) of alleys between plots. Four plugs were transplanted in each plot with a 2-foot (0.61-meter) distance. Weeds were controlled using Ronstar 2G preemergence
herbicide at 2 pounds oxadiazon per acre (2.24 kilograms per hectare) after transplanting. Plots received 1 pound of nitrogen per 1,000 square feet (48.8 kilograms of nitrogen per hectare) each in July and August in 2017 and 1 pound of nitrogen per
1,000 square feet each in late May and early July in 2018 and 2019 to promote the growth. Alleys were periodically sprayed with glyphosate to kill excessive growth that might cause cross contamination.
In early March of 2018 and 2019 before SG, plots were mowed at 1 inch (2.54 centimeters) to remove the dormant canopy. Approximately 1 inch of irrigation was applied weekly using an overhead irrigation system to prevent drought stress during SG and the
growth period. After plots reached approximately 100% coverage, irrigation was withheld to initiate a drought period under natural rainfall conditions. The drought period began on July 17, 2018, and July 6, 2019. Mowing was discontinued when genotypes
showed initial drought stress symptoms. The drought period was concluded on Oct. 4, 2018, and Sept. 11, 2019. After drought was concluded, irrigation was resumed for recovery until the first frost.
Visual ratings of turfgrass quality (TQ) and leaf firing (LF) were scored based on the National Turfgrass Evaluation Program rating scale of 1 to 9 (10). A value of 1 represented completely dead or dormant turf, 9 was outstanding turf, and 6 was minimally
acceptable turf. Images were taken to calculate the percent green cover (PGC) using TurfAnalyzer (8). Drought response data were collected six times in 2018 and six times in 2019. Visual ratings of SG were made on a scale of 1-9, with 1 being no green
color and 9 being fully green in a plot (10). Spring green-up percent green cover (SGPGC) was calculated using the same method for PGC as described above. Spring green-up ratings and SGPGC data were collected three times in 2018 and four times in
2019.
Year, rating date, replications and genotype were considered random effects. Reliability (i2) for SG and drought response was estimated using the following formula: i2 = VG/VP, where VG is the genetic variance and VP is the total phenotypical variance
(5). Linear mixed model methods were used to estimate the variance components using Type 3 method of moments. All analyses were conducted using SAS V9.4 software.
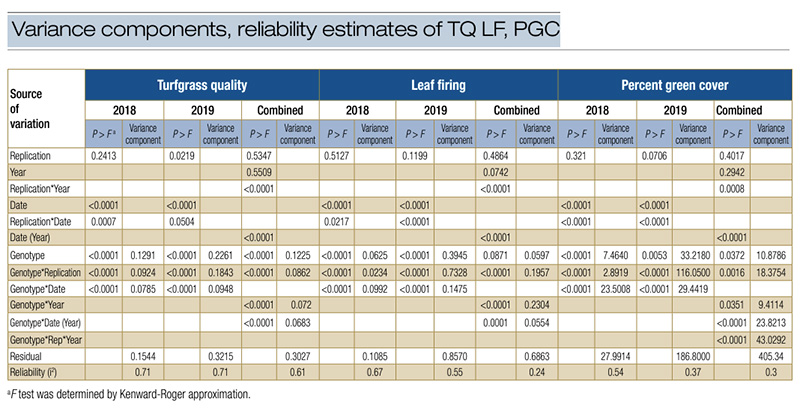
Table 2. Variance components and reliability estimates of turfgrass quality, leaf firing and percent green cover of 84 bermudagrass genotypes.
Results and discussion
Drought response
In 2018, at the end of the drought period, TQ ratings collected on Oct. 4 ranged from 2.0 to 5.5, LF rating from 4.7 to 9.0 and PGC from 32.8% to 95.0% (Table 1 and Figure 1). In 2019, based on the last rating, many of the genotypes demonstrated numerically
lower TQ, LF and PGC compared to their 2018 values due to more intense water-deficit stress in the summer of 2019. Based on the ANOVA results, significant (p < 0.05) genotype effects were detected for TQ and PGC, indicating the genetic component
played a significant role in the drought response. Besides, significant genotype-by-year interaction and genotype-by-date within year interaction were identified, indicating genotypes did not consistently respond to the environment over the two years,
and genotypes responded differently at different water-deficit levels or environmental conditions in a year.
Due to the highly significant genotype effect, the reliability estimate for TQ was i2 = 0.61 (Table 2), indicating that 61% of the observed variation in TQ was attributed to the genetic difference under drought stress. The reliability estimate for PGC
was i2 = 0.30. Due to the insignificant genotype effect, the reliability estimate of LF was low (i2 = 0.24). When reliability was estimated by year, the genotype effects were highly significant (p < 0.001) for all variables except for PGC in 2019,
and the reliability values were higher compared to analysis using the combined data (Table 3). This suggests that different environments in each year and the environment-by-genotype interactions affected the drought response indicators. Schwartz et
al. (12) reported large error variance and low broad-sense heritability were common for stress-related traits in zoysiagrass, which was consistent with our findings in this study.
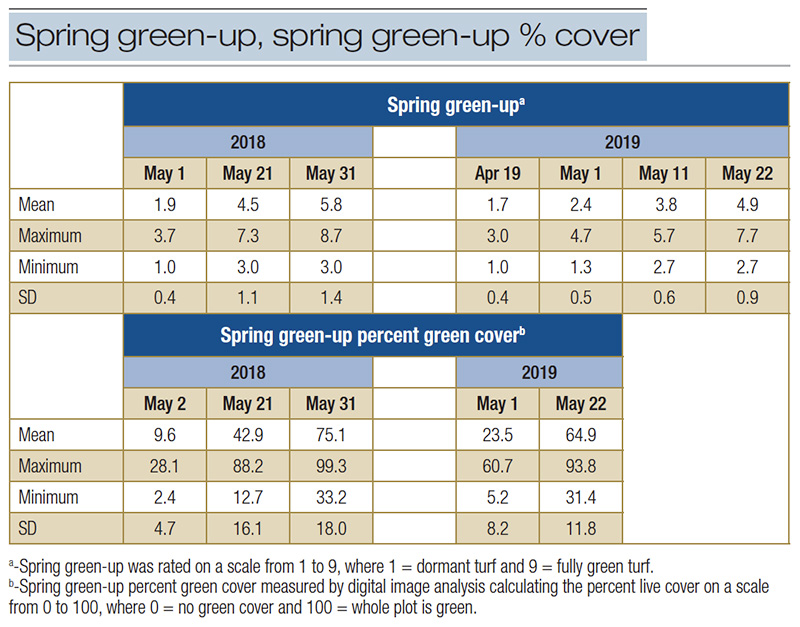
Table 3. Means, ranges and standard deviations for mean spring green-up and spring green-up percent green cover of 84 bermudagrass genotypes.
Spring green-up
In 2018, the last SG rating ranged from 3.0 to 9.0 and PGC from 29.6% to 99.9% (Table 3 and Figure 2. In 2019, many of the genotypes demonstrated numerically lower SG and SGPGC. The SG and SGPGC analyses showed that genotypic variances were not significant
using combined data (Table 4). Genotype-by-year interactions and the genotype-by-date within year interactions were highly significant (p < 0.001), suggesting genotypes responded differently over the two years and different dates within each year.
Due to insignificant genotype effects, the reliability estimates for SG and SGPGC were i2 = 0.13 and i2 = 0.33 (Table 4), respectively, which was much lower than common bermudagrasses (H2 = 0.77 – 0.91) reported by Stefaniak et al. (13) and
African bermudagrasses (H2 = 0.89) reported by Kenworthy et al. (9).
The low SG and SGPGC reliabilities in this study were likely due to testing drought response far into the late season, as in October. The apparent lack of a sufficient drought recovery period prior to winter dormancy might have influenced SG and SGPGC.
To test how drought injury influenced the SG and SGPGC reliability estimation, data were analyzed by year. The genotype effects of SG and SGPGC were highly significant (p < 0.001), resulting in a reliability estimate greater than i2 = 0.70 each
year. This suggests that even with dramatic differences in SG between 2018 and 2019 values, the relative SG performance was consistent across two years.
No reports have previously attributed summer drought stress and associated tissue/organ injuries to subsequent winterkill or delayed SG. It appears that drought injury to tissue or organs of some bermudagrass genotypes in 2018 resulted in increased winter
injuries in 2019. However, for some genotypes with little or no drought injuries, the metabolites produced from osmotic adjustments may facilitate the cold acclimation process that helps bermudagrasses gain winter hardiness, resulting in early SG
(4). Schwartz et al. (12) reported low-to-moderate SG heritability in zoysiagrass when subjected to stresses. Thus, to accurately quantify spring green-up reliability, abiotic and biotic stresses should be minimized in the previous summer, or stress-related
injuries need full recovery before going dormant in the fall. However, testing and selection in multi-stressed environments can identify a few superior genotypes with steady performance.
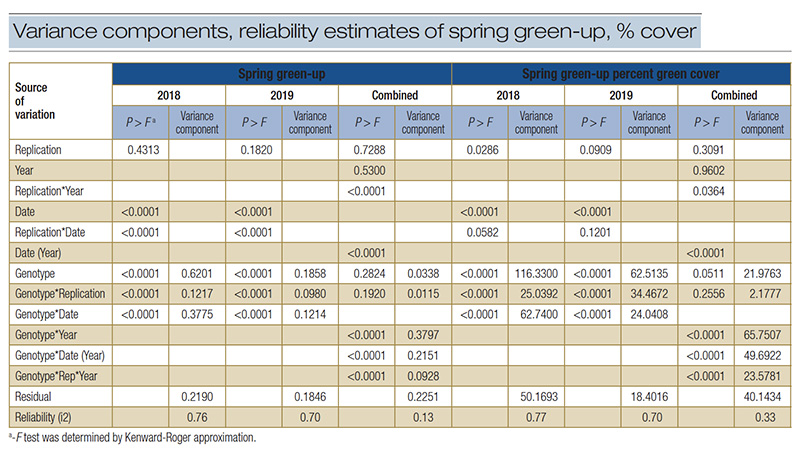
Table 4. Analysis of variance, variance components and reliability estimates of spring green-up and percent spring green cover in 84 turf bermudagrass genotypes.
The research says
- Moderate-to-high reliability estimates were found for drought response.
- The low spring green-up and spring green-up percent green cover reliability estimates caused by drought stress and genotype-by-environment interactions indicated that winter survivability selection was unreliable when tested in the same trial if drought
injuries were not fully recovered.
- Drought injuries can influence the overwintering ability of turf-type bermudagrasses if injuries are not fully recovered before winter dormancy.
- Testing winter survivability and drought response should be conducted in separate trials for turf-type bermudagrass.
- Irrigating bermudagrass to recover from drought injury before winter dormancy may prevent or reduce abnormal winterkill noticed during the following spring.
Acknowledgments
This work was funded in part by the USGA, USDA SCRI grants 2015-51181-24291 and 2019-1455-05/2019-5118130472, and the Oklahoma Agricultural Experiment Station. We would like to thank Cameron Murley, Ryan Schlobohm and Bradly Battershell for assisting
in fieldwork, and Pu Feng for work in the greenhouse.
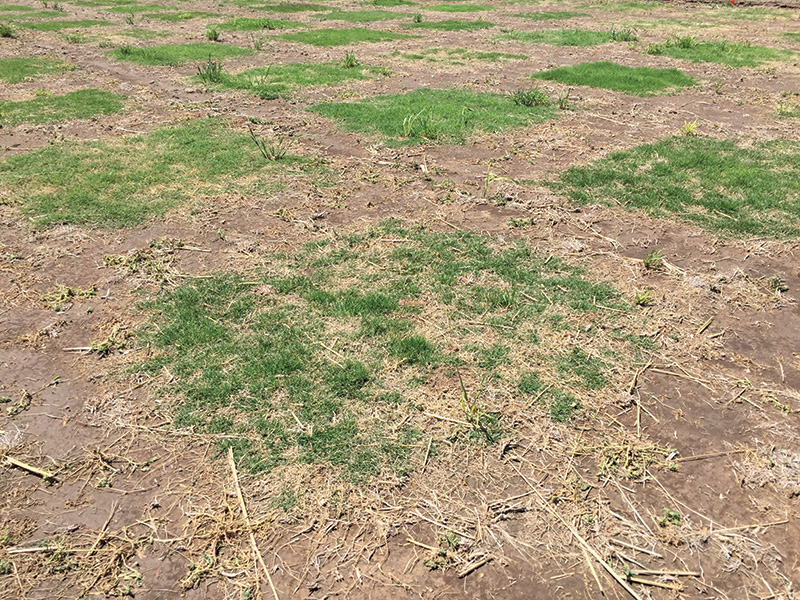
Figure 2. The turf-type bermudagrass population showed marked variation in spring green-up in late May of 2018.
Literature cited
- Anderson, J.A., and C.M. Taliaferro. 2002. Freeze tolerance of seed-producing turf bermudagrasses. Crop Science 42(1):190-192 (https://doi.org/10.2135/cropsci2002.1900).
- Bernardo, R. 2002. Breeding for quantitative traits in plants. Stemma Press, Woodbury, Minn.
- Carrow, R.N. 1995. Drought resistance aspects of turfgrasses in the southeast: Evapotranspiration and crop coefficients. Crop Science 35(6):1685-1690 (https://doi.org/10.2135/cropsci1995.0011183X003500060029x).
- Du, H., Z. Wang, W. Yu and B. Huang. 2012. Metabolic responses of hybrid bermudagrass to short-term and long-term drought stress. Journal of the American Society Horticultural Science 137(6):411-420 (https://doi.org/10.21273/JASHS.137.6.411).
- Hallauer, A.R. 1970. Genetic variability for yield after four cycles of reciprocal recurrent selections in maize. Crop Science 10(5):482-485 (https://doi.org/10.2135/cropsci1970.0011183X001000050007x).
- Hallauer, A.R., and J.B. Miranda. 1981. Quantitative genetics in maize breeding, first edition. Iowa State University Press, Ames, Iowa.
- Harlan, J.R., and J.M.J. deWet. 1969. Sources of variation in Cynodon dactylon (L). Pers. Crop Science 9(6):774-778 (https://doi.org/10.2135/cropsci1969.0011183X000900060031x).
- Karcher, D.E., C.J. Purcell, M.D. Richardson, L.C. Purcell and K.W. Hignight. 2017. A new java program to rapidly quantify several turfgrass parameters from digital images. CSSA Oral Presentation (https://scisoc.confex.com/crops/2017am/webprogram/Paper109313.html).
- Kenworthy, K.E., C.M. Taliaferro, B.F. Carver, D.L. Martin, J.A. Anderson and G.E. Bell. 2006. Genetic variation in Cynodon transvaalensis Burtt-Davy. Crop Science 46(6):2376-2381( https://doi.org/10.2135/cropsci2006.02.0075).
- Morris, K.N., and R.C. Shearman. 2000. NTEP turfgrass evaluation guidelines. National Turfgrass Evaluation Program (online). Available at http://www.ntep.org/pdf/ratings.pdf.
- Oklahoma Climatological Survey. 2020. Online. Available at http://climate.ok.gov/index.php/climate.
- Schwartz, B.M., K.E. Kenworthy, M. Engelke, A.D. Genovesi and K.H. Quesenberry. 2009. Heritability estimates for turfgrass performance and stress response in Zoysia spp. Crop Science 49(6):2113-2118 (https://doi.org/10.2135/cropsci2008.12.0705).
- Stefaniak, T.R., C.A. Rodgers, R. Van Dyke, D.W. Williams and T.D. Phillips. 2009. The inheritance of cold tolerance and turf traits in a seeded bermudagrass population. Crop Science 49(4):1489-1495 (https://doi.org/10.2135/cropsci2008.09.0564).
- Steinke, K., D. Chalmers, J. Thomas and R. White. 2011. Bermudagrass and buffalograss drought response and recovery at two soil depths. Crop Science 51(3):1215-1223 (https://doi.org/10.2135/cropsci2010.08.0469).
- Taliaferro, C.M., F.M. Rouquette Jr. and P. Mislevy. 2004. Bermudagrass and stargrass. Pages 417-475. In L.E. Moser, B.L. Burson and L.E. Sollenberger, eds. Warm-season (C4) grasses ASA Monograph 45.
- Wu, Y.Q., C.M. Taliaferro, D.L. Martin, J.A. Anderson and M.P. Anderson. 2007. Genetic variability and relationships for adaptive, morphological, and biomass traits in Chinese bermudagrass accessions. Crop Science 47(5):1985-1994 (https://doi.org/10.2135/cropsci2007.01.0047).
- Xiang, M., J. Fry and Y.Q. Wu. 2019.Winter survival of experimental bermudagrasses in the upper transition zone of the U.S. International Turfgrass Society Research Journal 14(1):708-712 (https://doi.org/10.1002/its2.3).
- Yu, S. 2017. Advanced turf-type bermudagrass and zoysiagrass experimental genotypes show marked variation in responses to drought stress under field conditions. M.S. thesis. Oklahoma State University.
Shuhao Yu (shuhao.yu@okstate.edu) is a research assistant professor, Dennis L. Martin and Justin Q. Moss are professors, Charles H. Fontanier is an associate professor, all in the Department of Horticulture and Landscape Architecture, Oklahoma State University;
Carla Goad is a professor in the Department of Statistics at Oklahoma State University; and Yanqi Wu is a regents professor in the Department of Plant and Soil Sciences, Oklahoma State University.