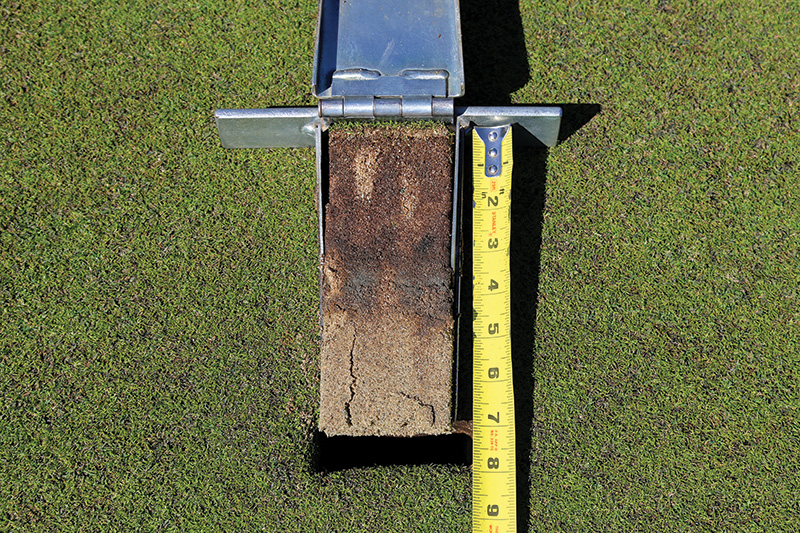
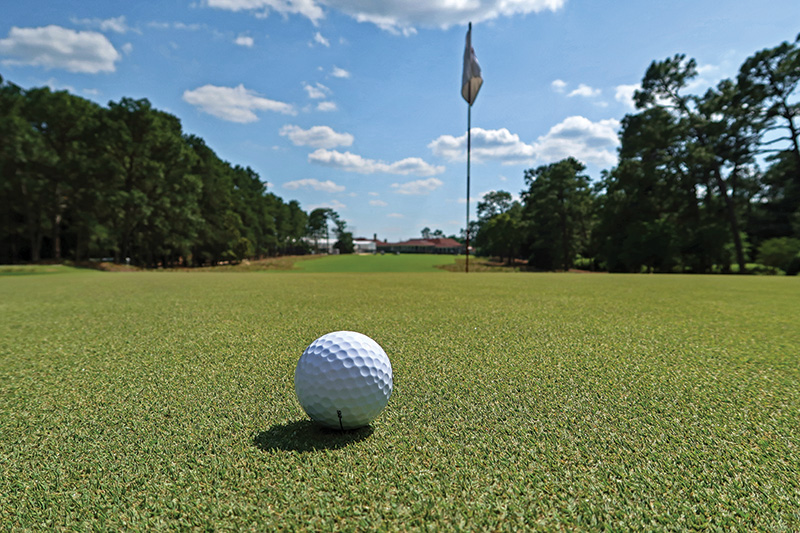
While developing a standardized method for putting green organic matter sampling and testing, we took samples from hundreds of greens across the country and learned quite a bit about organic matter accumulation and management. Photos courtesy of the USGA
Editor’s note: This article is reprinted with permission from the Dec. 5, 2024, issue of the USGA Green Section Record. Copyright USGA. All rights reserved. The original article can be accessed at: https://bit.ly/40uKtwt.
Testing putting green organic matter (OM) is not a new concept. Numerous organic matter tests, including the “OM246” method, have been around for years. The challenge with OM testing has been the fractured nature of testing protocols. Different labs or experts have varied perspectives on how to test, what to test and how to report the results. This makes fruitful discussions about OM levels among researchers and superintendents difficult. It is as if everyone is speaking a different language. This has held back superintendents and researchers from fully understanding OM accumulation in putting greens and how OM impacts playing quality, turf health and ultimately the golfer experience.
The USGA Green Section convened a group of researchers and experts to develop an industry standard for sampling and measuring putting green OM. In early 2024, this group released its recommendations, which you can read about in the Green Section Record article “A standard method for measuring putting green organic matter” (https://bit.ly/4hyZc0q). The Green Section adopted this standard method, and today it is used by all USGA agronomists.
In the process of developing this method, researchers and USGA agronomists sampled hundreds of putting greens of differing ages and turf types. We learned much about putting green OM and wanted to share some of the key findings in the hopes of creating a more-precise language around OM levels and advancing the art and science of putting green management. Without further ado, let’s dive into what the team learned after analyzing over 1,600 cool- and warm-season putting green samples from across the country using the new standardized method.
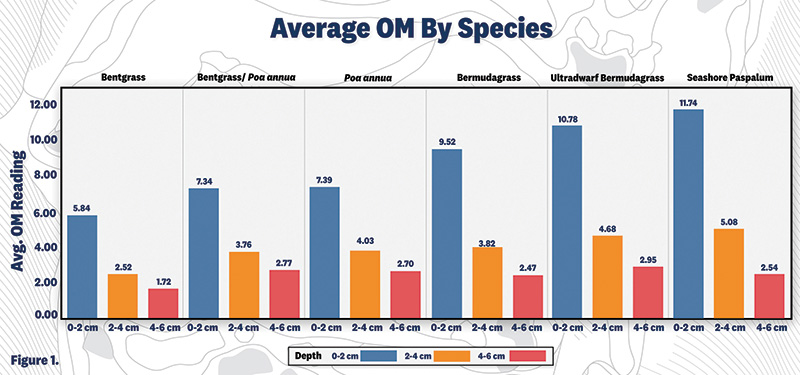
Figure 1. The average OM values at the three sampling depths for each grass species that comprised the putting greens we sampled. This data was derived from more than 1,600 individual samples from approximately 400 courses around the country.
Average OM levels vary by grass species
The warm-season greens we tested (seashore paspalum, ultradwarf bermudagrass and bermudagrass) have higher levels of OM at all testing depths than cool-season species (creeping bentgrass, Poa annua and mixed bentgrass/Poa annua stands). This may be due to the morphological characteristics of these grasses. Warm-season grasses have a dense network of rhizomes and stolons that is not present in most cool-season species. It is interesting to observe that Poa annua and mixed bentgrass/Poa annua samples had similar amounts of OM, while bentgrass-only samples had the lowest levels of OM of all species (Figure 1). One explanation is that perhaps most of the bentgrass/Poa annua putting greens tested have far more Poa annua than bentgrass.
For all grass species, OM values trend lower with depth
In other words, OM between 0.79-1.58 inches (2-4 centimeters) is lower than OM at 0-0.79 inch (0-2 centimeters), and OM at 1.58-2.36 inches (4-6 centimeters) is lower than at 0.79-1.58 inches. As OM becomes buried with topdressing over time or as turf growth continues, it appears as if the rate or total amount of decomposition deeper in the soil accelerates. The pattern of decreasing OM with depth is reflected in Figure 1 for all the grass species tested.
Variability in OM content is highest at the surface
Variability in OM levels from course to course decreased deeper in the soil profile (Figure 2). Variability is greatest in the 0-0.79-inch depth followed by the 0.79-1.58-inch depth. Variability is lowest in the 1.58-2.36-inch depth. It is clear that management practices have the largest impact on what is happening at or near the surface, and that is the area of greatest differentiation in putting green OM content among golf courses.
Using a standardized method for OM sampling and testing allows superintendents to better understand how their programs affect OM accumulation and how their greens compare to national averages.
OM can get out of hand quickly, but it doesn’t have to
On a new putting green, OM by weight is less than 1%, and it increases with plant growth over time. However, it is not necessarily true that a 10-year-old putting green has higher OM levels than a 5-year-old putting green. Management practices such as fertilization and topdressing play a large role in how OM accumulates over time.
Table 1 shows three courses with bentgrass putting greens of different ages. The data provides an indication that although OM will naturally accumulate over time, the concentration (i.e., percentage) is influenced by management practices. The OM for Course 1 in the 0-0.79-inch layer is near the 10th percentile (among the lowest), while Course 3 has OM near the 90th percentile (among the highest) — same species, similar age, dramatically different OM levels. What’s the difference? The answer is in how they approach nitrogen applications and sand topdressing. And in case anyone is curious, Course 1 has not performed core aeration in the last six years. They use solid tines only and fill the holes with sand.
Course 2 has 30-year-old bentgrass putting greens with an OM level near the 10th percentile. It should not be a surprise that this course is committed to a season-long topdressing program and applies nitrogen based on clipping volume generated.
Sometimes, people assume that keeping OM as low as possible is the objective. This is not the case. What I advocate for is an understanding that the range of OM values on golf courses varies from course to course, and there is no “magic number” that every course should target. Identifying the factors that influence OM accumulation and understanding how OM levels impact the golfer experience at your facility are what matter. This should aid in making decisions about how to manage OM over the long term based on your course’s circumstances and desired product.
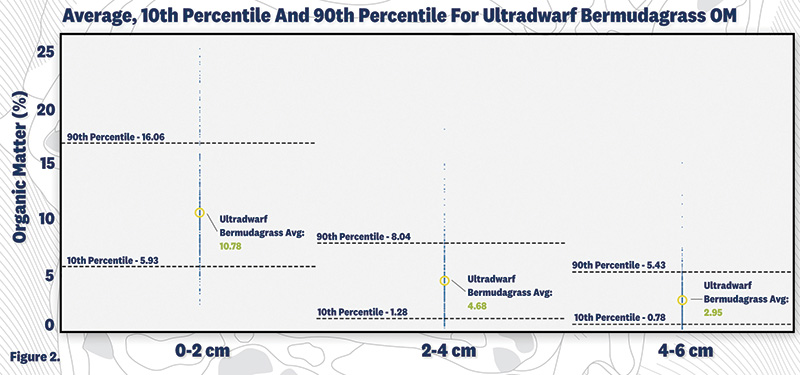
Figure 2. The ranges between the 10th percentile and 90th percentile at all three OM testing depths for the ultradwarf bermudagrass greens we sampled. Notice that the gap is widest at the shallowest depth, showing that is where courses differ the most. This trend was also observed in the other grass species.
Percent OM is a window into past management and offers lessons for the future
Looking at the extreme cases — putting greens in the 10th percentile and those in the 90th percentile of OM in the top 0.79 inch — provides insights into past management.
OM is created through plant growth, and nitrogen is the primary driver of plant growth. Therefore, high OM is likely the result of higher annual rates of nitrogen.
On the flip side, topdressing sand typically has no OM in it.
Very low levels of OM may be the result of low levels of plant growth and above-average annual topdressing rates.
Year-over-year tests provide data that becomes actionable
The beauty of OM testing is its site-specific nature. Testing will benefit superintendents with new putting greens or mature ones. A superintendent with new putting greens may expect and want OM levels to increase. Using a standardized sampling and testing method over time will confirm the degree to which the management decisions were successful or not. A superintendent with mature putting greens may want OM levels to stay the same or decrease. Regular testing is invaluable in this case, too, and is a reflection of how past decisions and practices have impacted percent OM.
When testing is performed regularly and compared with a robust database, OM levels of concern are easier to identify.
A single value of 10% OM in the top 0.79 inch is of little use unless it is put in context within a larger dataset.
A value of 10% that is at the 50th percentile for a given species provides much more helpful information. It tells the practitioner that in the universe of all samples taken for that species, about half were above and half were below their value.
Viewing that result in the context of previous tests at your facility is also important. Does that 10% represent an increase over time or a decrease? How are the surfaces performing over that time span?
Without regular testing with a consistent method, a given number loses much of its meaning. When many courses are using the same method, their collective results become a powerful tool.
There are many factors involved in putting green quality beyond organic matter content. Greens with more organic matter can still deliver excellent playing conditions.
Annual OM testing is validating nontraditional aeration programs
As an agronomist, it’s hard to look at a set of putting greens with OM levels at the 50th percentile in the 0-0.79-inch depth at a course that performs one or more annual core aerations, and on the next day look at a different set of greens with OM levels at the 50th percentile at a course where no core aeration is performed and conclude that pulling cores is a primary means of managing OM. It is unlikely that the absence of core aeration creates an OM problem or that performing core aeration solves one. There are other dynamics that play a much larger role.
There is much talk in the golf course maintenance world about the role of core aeration and whether it’s necessary to pull cores to produce a high-quality putting surface. While developing our standardized OM testing method, we observed examples of courses that have been successful without core aeration, but they usually make significant adjustments to topdressing and nitrogen rates. This is a great topic to discuss, but to do it justice, it must be the subject of another article.
Are my current OM levels good or bad?
Most superintendents want to know if their test results are good or bad. This type of question is an occupational hazard whenever tests assign a number to anything. Instead of focusing on a predetermined number or percentile, ask a few diagnostic questions in conjunction with OM test results, such as:
- Can you move water through the profile?
- Can you maintain healthy turf?
- Is the surface firmness favorable for your golfers?
If the answer is yes to all of these, the current OM levels are probably appropriate for your course. If the answer is no to one or more, then you may need to get more aggressive with OM management. The number from a soil test should always be related to performance.
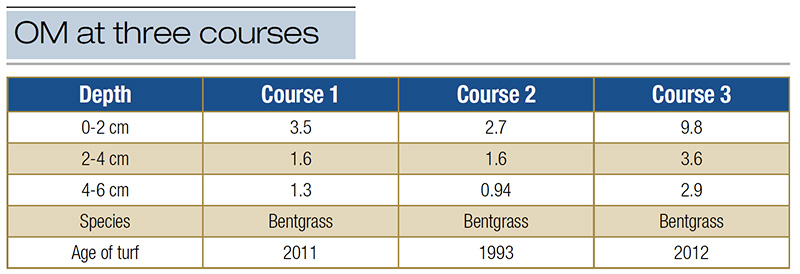
Table 1. When it comes to OM accumulation, our study results demonstrate that how putting greens are managed is more important than how old they are. In this example, the average OM from bentgrass greens that are more than 30 years old is lower than greens that are much newer.
Establishing a relationship between firmness and OM is complicated
Putting green management would be simpler if one could say that at a certain percentage of OM, firmness would fall within a certain range. Unfortunately, it is not that simple.
There are complex interactions at work between OM, soil moisture, annual topdressing rates, characteristics of the topdressing sand being used — e.g., particle size analysis, coefficient of uniformity, and angularity — and other factors. The morphology of different turf species confounds the connection between OM and firmness even more. Poa annua is a much different plant above and below the surface than an ultradwarf bermudagrass plant. Those physical characteristics have an impact on firmness regardless of OM content.
OM test results don’t tell you about the quality of the putting surface
This may seem intuitive, but in an article where the focus is on the top 2.36 inches of the putting green root zone, one must not forget that surface management practices are the building blocks of ball roll quality and the subsequent golfer experience. OM content is certainly related to putting quality in several ways, but greens with relatively high OM measurements can play well, and greens with low OM can play poorly. Successful putting green management requires a comprehensive approach — OM testing and management is an important part of that, but it is not the whole story.
A few final thoughts
Using a standardized method of putting green OM testing is reshaping conversations around putting green management, which is encouraging. When golf courses use the same test, discussions around OM-related topics such as topdressing, fertilization and aeration become much more precise and relatable. When OM tests from many golf courses are consolidated into a database like the one we are currently building, local, regional and national norms can be identified. Having both site-specific results and broader averages speeds up the process of planning topdressing, fertilization and cultivation programs for the upcoming year. This knowledge allows superintendents to be confident that they are managing the organic matter in their putting greens, rather than letting organic matter manage them.
The research says
- We learned much about putting green OM and wanted to share some of the key findings in the hopes of creating a more-precise language around OM levels and advancing the art and science of putting green management.
- For all grass species, OM values trend lower with depth. As OM becomes buried with topdressing over time or as turf growth continues, it appears as if the rate or total amount of decomposition deeper in the soil accelerates.
- Average OM levels vary by grass species. The warm-season greens we tested have higher levels of OM at all testing depths than cool-season species. This may be due to the morphological characteristics of these grasses: Warm-season grasses have a dense network of rhizomes and stolons that is not present in most cool-season species.
- What I advocate for is an understanding that the range of OM values on golf courses varies from course to course, and there is no “magic number” that every course should target. Identifying the factors that influence OM accumulation and understanding how OM levels impact the golfer experience at your facility is what matters.
Chris Hartwiger (chartwiger@usga.org) is director of agronomy at the U.S. Golf Association. He is a 20-year Educator member of GCSAA.