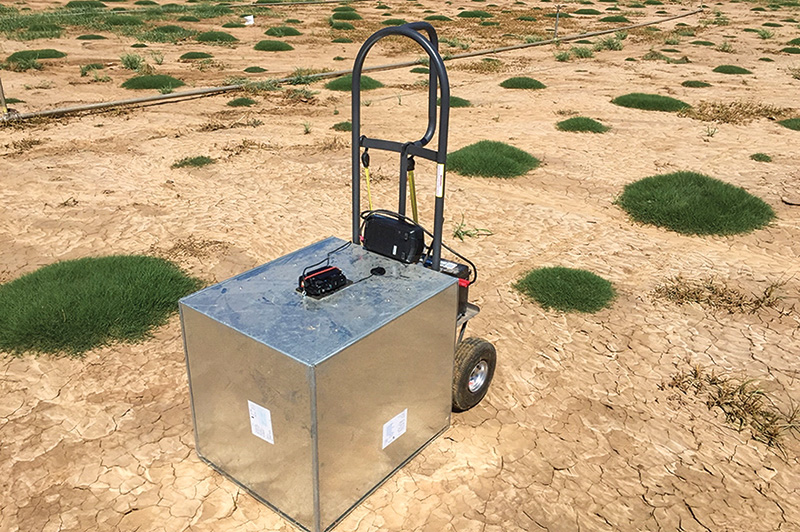
Research was conducted from 2017-2020 at the Oklahoma State University Agronomy Farm, Stillwater, Okla. Photo by Shuhao Yu
African bermudagrass (Cynodon transvaalensis Burtt Davy) is a diploid species endemic in the southwestern Transvaal and the northern part of the central Cape Province of South Africa (6). African bermudagrass has fine texture and high shoot density and
is morphologically distinct from other Cynodon species. Its linear-lanceolate leaf blades are around 0.04 inch (1.0 millimeter) in width and often have a yellowish-green color with sparse hairs. Stolons of African bermudagrass are slender with shortened
internodes (4). African bermudagrass inflorescences are small, usually 0.79-1.57 inches (2-4 centimeters) long, with two (often) to four (rarely) racemes in a whorl, and flowering culms are approximately 3.94 inches (10 centimeters) tall (4, 8).
African bermudagrass as turf is limited by relatively high management requirements, declined quality in summer and discoloration under cool temperatures (8). African bermudagrass has significant value for the turf industry as a parent to artificial two-way
crosses with common bermudagrass [Cynodon dactylon L. (Pers)] to create interspecific F1 hybrid (C. dactylon × C. transvaalensis) (2n = 3x = 27 or 2n = 4x = 36) cultivars that are popular choices for residential lawns, golf courses and athletic
fields in the southern and transitional climatic regions of the United States (2, 6). For example, Tahoma 31, Tifway and TifTuf are popular F1 hybrid cultivars. African bermudagrass generally contributes genes for several turfgrass quality traits,
such as fine leaf blades and high sod density (1, 12). Leaf and stem are two major parts of bermudagrass canopy. The leaf area is critical in determining the canopy’s biomass yield potential, as the leaf is the major site for photosynthesis
(5). Besides affecting photosynthesis, leaf size correlates with agronomic traits such as stress tolerance in common bermudagrass (14). Stems are the main organs for transporting raw materials absorbed by roots and carbohydrates from photosynthesis
to sink tissues. Bermudagrass with short stem internode length may tolerate lower mowing height and produce more leaves to have better mowing tolerance. In addition, a larger stem internode diameter could be more resistant to stem breakage, which
contributes to better tolerance to traffic stress.
There have been studies to document the morphological traits and variations of African bermudagrass. Kenworthy et al. (2006) evaluated plant height (PH), stolon length, number of internodes, internode length, leaf length, color and density in African
bermudagrass and found that these traits are mostly genetically controlled and can be environmentally influenced. Quantitative trait loci (QTL) analysis has been used as a primary method to bridge the connection between DNA regions (genotypes) and
traits (phenotypes) to understand which QTL/genes control the desirable traits. Khanal et al. (2019) reported 11 QTL for morphological traits, such as leaf length, leaf width, PH, stolon internode length and the longest stolon length in African bermudagrass.
In this study, we used a high-density African bermudagrass linkage map to identify the QTL associated with one canopy trait, PH; two leaf morphological traits, leaf blade width (LBW) and leaf blade length (LBL); and two stem morphological traits,
SIL and SID.
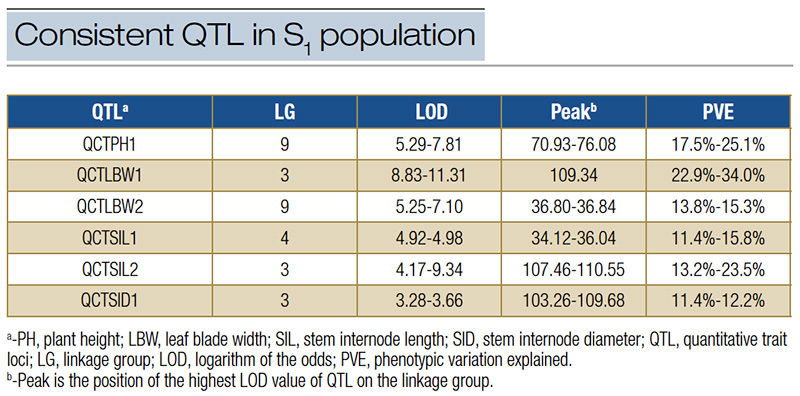
Table 1. Consistent QTL for PH, LBW, SIL and SID were detected in the S1 population of OKC1163 African bermudagrass.
Materials and methods
A mapping population of 109 first-generation self-pollinated progeny of the African bermudagrass genotype “OKC1163” was transplanted to a field nursery on the Oklahoma State University Agronomy Farm, Stillwater, Okla., on June 20, 2017. The
experimental design was a randomized complete block with three replications. Plots were 3 feet × 3 feet (0.9 meter × 0.9 meter) with an alley 1 foot (0.3 meter) wide between neighboring plots. Plots received 2 pounds nitrogen per 1,000
square feet (97.7 kilograms per hectare) per year from 2017 to 2020. Weeds were controlled using Ronstar 2G preemergent herbicide and frequent hand weeding. Adequate irrigation was applied to prevent drought stress in 2017 during the establishment
phase. After spring green-up from 2018 to 2020, plots were mowed at 1.5 inches (3.8 centimeters) to promote a relatively uniform growth for sample collection.
In early July, full-length stems were collected randomly from five random spots in each plot and placed in a plastic bag. Bags were immediately placed into a chest filled with ice packs to keep samples fresh during collection and then stored in a freezer
at minus 4 F (minus 20 C) for subsequent measurements (14). The LBW, LBL, SIL and SID were measured on the stored samples with a digital caliper. Leaf blade width and length were measured on both leaves originating from the third node. Stem internode
length and SID were measured on the internode between the second and third nodes. The leaf blade width was measured at the widest part of the leaf blade. Plant heights were measured in the first week of September 2018 and the second week of August
2019. The height from the ground to the top of the leaves was measured using tape at five random spots in each plot.
The broad-sense heritability (H2) for morphological traits was estimated using the following formula: H2= VG/VP, where VG is the genetic variance and VP is the total phenotypical variance estimated using SAS V9.4 software. The detailed information on
the African bermudagrass linkage map used in this QTL mapping study was reported by Yu et al. (15). The best linear unbiased estimate (more accurate compared to using the arithmetic mean of three replications) of each trait was used for QTL analyses
via MapQTL 6.0 software (13). Based on the African bermudagrass reference genome (3), annotated gene sequences within QTL regions were extracted, and Blast2GO software was used for functional annotation.
Results
The heritability of PH was 0.31. Two QTL associated with PH were identified on LG9 (Table 1, Figure 1). QCTPH1 was a consistent QTL identified on LG9 between 70.93 and 76.08 cM (i.e., centiMorgan is a unit of measure for the frequency of genetic recombination),
explaining up to 25.1% of phenotypic variations.
The heritability of LBW was 0.72. Three QTL associated with LBW were identified, and two of them were consistent (Table 1, Figure 1). QCTLBW1 was consistently located at 109.34 cM on LG3, explaining up to 34.0% phenotypic variation. QCTLBW2 was consistently
located between 36.80 to 36.84 cM on LG9, explaining up to 15.3% of phenotypic variations.
LBL data was collected in 2019 only, and heritability was 0.73. Five QTL associated with LBL were identified in this study. They were located on LGs 3, 4, 7 and 9, explaining up to 18.2% of phenotypic variation. More work on different locations/years
is needed to determine which QTL for LBL was consistent.
The heritability of SIL was 0.65. Seven QTL associated with SIL were identified, and two of them, QCTSIL1 and QCTSIL2, were consistent. QCTSIL1 was located on LG4 and explained up to 15.8% of phenotypic variation. QCTSIL2 was located on LG3 and explained
up to 23.5% of phenotypic variation.
The heritability of SID was 0.34. Only one QTL associated with SID was consistently identified. QCTSID1 was detected on LG3 between 103.26 and 109.68 cM, explaining up to 12.2% of phenotypic variation.
Among all the identified QTL, only QCTLBW1 was consistently located in the same genomic region. Therefore, the genomic region on LG3 (represents Chromosome 3) between 54.7 and 56.1Mbp was selected for candidate gene identification. Candidate genes, such
as WUSCHEL-related homeobox protein and gibberellin 20 oxidase 2, may have biological functions influencing LBW.
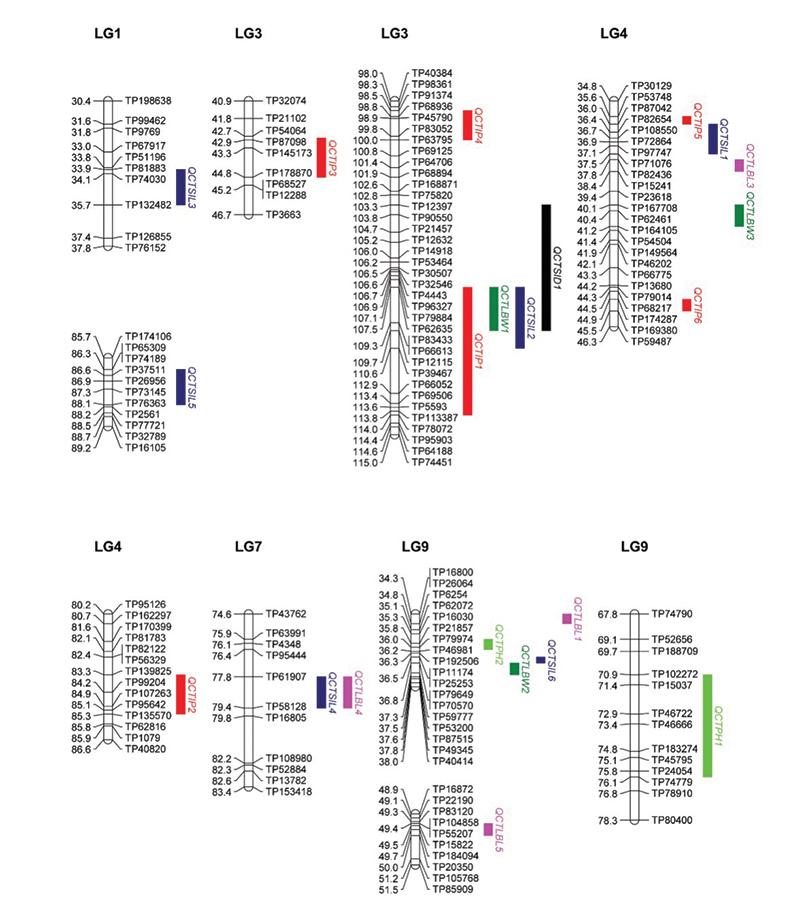
Figure 1. The locations of quantitative trait loci (QTL) peaks for plant height (PH), leaf blade width (LBW), stem internode length (SIL), stem internode diameter (SID) and leaf blade length (LBL) on the segments of OKC1163 linkage groups (LGs) 1, 3, 4, 5 and 9 generated from 1,278 markers mapped in 109 S1 bermudagrass progeny. Genetic distances (centiMorgans, cM) are listed on the left of each LG and corresponding markers are listed on the right.
Discussion
In this study, we estimated heritability and reported the QTL associated with morphological traits in African bermudagrass. Moderate to high heritability was found for the morphological traits, indicating most traits were substantially controlled by genes
but can be easily influenced by environments. A total of 18 QTL were identified, and six of them showed consistent genetic effects. For high heritability traits, such as SIL and LBW, we identified multiple consistent QTL. For PH and SID, we were able
to identify consistent QTL even though their heritability was relatively low. It is less reliable to phenotypically select traits with lower heritability. Our study showed that these traits are controlled by QTL/genes, but their phenotypes are more
easily affected by environments than other high-heritability traits.
We observed several genomic regions clustered with QTL for different traits. For instance, on LGs 3, 4 and 9. Several LBW, SIL, SID and PH QTL were co-located. By searching for candidate genes within an LBW QTL on LG3 clustered regions, we found the genes
that showed high identity to known genes that control LBW, such as WUSCHEL-related homeobox protein, which controls LBW in rice (7). The candidate gene Gibberellin 20 oxidase 2 plays roles in plant hormone signaling and has been characterized in rice
as semidwarf (sd-1) allele to reduce the overall plant height (11). The genetic and genomic information revealed from this study showed promise for developing molecular markers in accelerating the selection process of fine texture, high-turfgrass
quality bermudagrass cultivars.
The research says
- Moderate to high heritability was found for morphological traits in African bermuda-grass.
- This study discovered 18 quantitative trait loci (QTL) associated with morphological traits. Six of these QTL were consistent across at least two years.
- Three consistent QTL regions overlap among morphological traits. These QTL regions can be used to develop molecular markers.
- Elite African bermudagrass can be used as breeding materials to develop fine texture, high turfgrass quality interspecific hybrid bermudagrass.
Acknowledgments
This work was funded, in part, by the United States Department of Agriculture Specialty Crop Research Initiative 2015-51181-24291 and 2019-1455-05/2019-51181-30472, Oklahoma Turf Research Foundation and Oklahoma Agricultural Experiment Station. We would
like to thank Pu Feng and Bradley Battershell for their assistance in the greenhouse and in the field, respectively.
Literature cited
- Burton, G.W. 1974. Breeding bermudagrass for turf. In Proceedings of the Second International Turfgrass Research Conference. Pages 18-22. American Society of Agronomy, Crop Science Society of America.
- Burton, G.W. 1991. A history of turf research at Tifton. USGA Green Section Record 29:12-14.
- Cui, F., G. Taier, M. Li, X. Dai, N. Hang, X. Zhang, X. Wang and K. Wang. 2021. The genome of the warm-season turfgrass African bermudagrass (Cynodon transvaalensis). Horticulture Research 8:1-16 (https://doi.org/10.1038/s41438-021-00519-w).
- de Wet, J.M.J., and J.R. Harlan. 1970. Biosystematics of Cynodon L.C. Rich. (Gramineae). Taxon 19:565-569 (https://doi.org/10.2307/1218950).
- Duncan, W.G. 1971. Leaf angles, leaf area, and canopy photosynthesis. Crop Science 11:482-485 (https://doi.org/10.2135/cropsci1971.0011183X001100040006x).
- Harlan, J.R., J.M.J. de Wet and K.M. Rawal. 1970. Geographic distribution of the species of Cynodon L.C. Rich (Gramineae). East African Agricultural and Forestry Journal 36:220-226 (https://doi.org/10.1080/00128325.1970.11662465).
- Ishiwata, A., M. Ozawa, H. Nagasaki, M. Kato, Y. Noda, T. Yamaguchi, M. Nosaka, S. Shimizu-Sato, A. Nagasaki, M. Maekawa, H.-Y. Hirano and Y. Sato. 2013. Two WUSCHEL-related homeobox genes, narrow leaf2 and narrow leaf3, control leaf width in rice.
Plant and Cell Physiology 54:779-792 (https://doi.org/10.1093/pcp/pct032)
- Juska, F.V., and A.A. Hanson. 1964. Evaluation of bermudagrass varieties for general purpose turf. Agricultural handbook No. 270. USDA-ARS.
- Kenworthy, K.E., C.M. Taliaferro, B.F. Carver, D.L. Martin, J.A. Anderson and G.E. Bell. 2006. Genetic variation in Cynodon transvaalensis Burtt-Davy. Crop Science 46(6):2376-2381 (https://doi.org/10.2135/cropsci2006.02.0075).
- Khanal, S., J.C. Dunne, B.M. Schwartz, C. Kim, S. Milla-Lewis, P.L. Raymer, W.W. Hanna, J. Adhikari, S.A. Auckland, L. Rainville and A.H. Paterson. 2019. Molecular dissection of quantitative variation in bermudagrass hybrids (Cynodon dactylon x transvaalensis):
Morphological traits. G3: Genes, Genomes, Genetics 9(8):2581-2596 (https://doi.org/10.1534/g3.119.400061).
- Spielmeyer, W., M.H. Ellis and P.M. Chandler. 2002. Semidwarf (sd-1),“green revolution” rice, contains a defective gibberellin 20oxidase gene. Proceedings of the National Academy of Sciences of the United States of America 99:9043-9048
(https://doi.org/10.1073/pnas.132266399).
- Taliaferro, C.M. 1992. Out of Africa — A new look at “African” bermudagrass. USGA Green Section Record 30:10-12.
- Van Ooijen, J.W. 2006. MapQTL 6: Software for the mapping of quantitative trait loci in experimental populations of diploid species. Kyazma B.V., Wageningen, the Netherlands
- Wu, Y.Q., C.M. Taliaferro, D.L. Martin, J.A. Anderson and M.P. Anderson. 2007. Genetic variability and relationships for adaptive, morphological, and biomass traits in Chinese bermudagrass accessions. Crop Science 47(5):1985-1994 (https://doi.org/10.2135/cropsci2007.01.0047).
- Yu, S., T. Fang, H. Dong, L. Yan, D.L. Martin, J.Q. Moss, C.H. Fontanier and Y.Q. Wu. 2021. Genetic and QTL mapping in African bermudagrass. The Plant Genome 14(1) (doi.org/10.1002/tpg2.20073).
Shuhao Yu (shuhao.yu@okstate.edu) is a research assistant professor, Dennis L. Martin and Justin Q. Moss are professors, and Charles H. Fontanier is an associate professor, all in the Department of Horticulture and Landscape Architecture; Yanqi
Wu is a regents professor and holds the Meibergen Family Professorship in plant breeding in the Department of Plant and Soil Sciences; and Liuling Yan is a regents professor and endowed Dillon and Lois Hodges Professor in the Department of Plant and
Soil Sciences, all at Oklahoma State University.