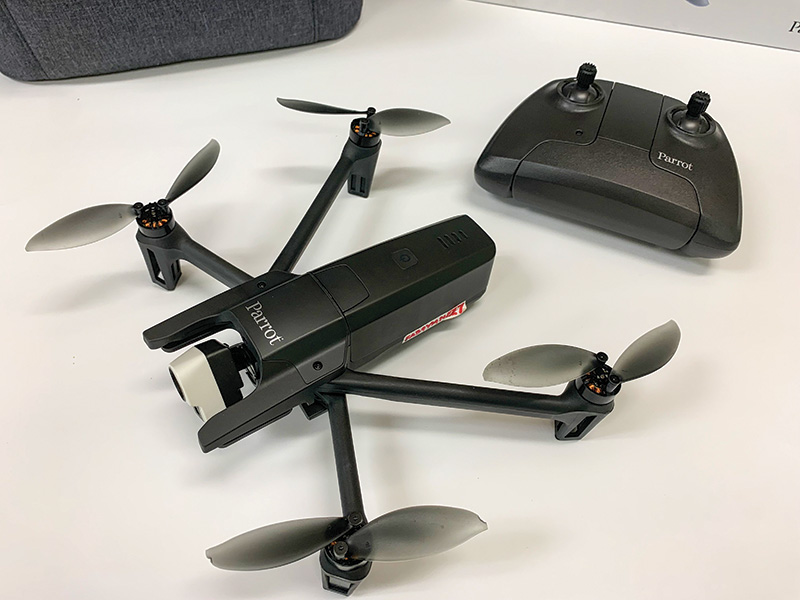
Figure 1. The Parrot ANAFI Thermal used in the study is equipped with a CMOS 1/2.4-inch camera with 21 megapixels, an f/2.4 aperture and sensors that capture electromagnetic radiation in the RGB bands. Photo by Todd Bates
Since its beginning, turfgrass science has relied on turfgrass visual quality ratings to access performance of turfgrass under different scenarios. While conventional visual rating systems may have their drawbacks, the eyes of trained observers are still one of the most valuable tools when it comes to turfgrass monitoring. However, the subjective nature of turfgrass quality rating systems has led to the need to assess how remote sensing monitoring tools may be more reliable for objective performance comparisons. Currently, the Normalized Difference Vegetation Index (NDVI) is commonly used in research settings when evaluating turfgrass performance, as well as when assessing vegetative health in general for both agricultural and horticultural crops (2, 3). Dark Green Color Index (DGCI), which is derived from red-green-blue (RGB) images, has also shown good correlation to visual quality, but its collection and analysis may require a significant amount of time. Unmanned aerial systems (UAS) could provide advantages to turf science when it comes to monitoring and assessing turf health, disease presence and nutrient status. These systems can be equipped to carry an onboard RGB color camera to aid in navigation and to also take ground photos of a research site.
Color image data are used to generate vegetation index (VI) values, which are mathematically derived integers calculated by reflectance values of light in different wavelengths. Even without the use of a UAS, simple color image data from cameras capturing an adequate subject area can be used to generate RGB VIs (5). The use of UAS-partnered RGB cameras opens possibilities for using VIs derived purely from RGB reflectance. Determining the most suitable VI to monitor, predict or classify turf quality and nutrient responses is essential to optimize the use of UAS with turfgrass research. Often, index data and measurements are used to correlate with yield or other quantitative outputs. In this context, turfgrass is a unique research crop, as the desired output is aesthetic (quality readings) and subjective to the human eye.
In this study, we examine the accuracy of UAS-derived RGB indices when correlated with visual quality ratings and NDVI. The objective of this study was to correlate RGB indices including the Green Leaf Index (GLI), Green Chromatic Coordinate (GCC), Modified Green-Red Vegetation Index (MGRVI), Modified Red-Blue Vegetation Index (MRBVI) and Normalized Green-Red Difference Index (NGRDI) with turfgrass visual quality and NDVI obtained from two warm-season species (bermudagrass and St. Augustinegrass) commonly grown in South Florida. Although some of these indices were originally developed for agriculture or forestry (1, 4, 7), their principles make them relevant for exploring turfgrass applications in this study.
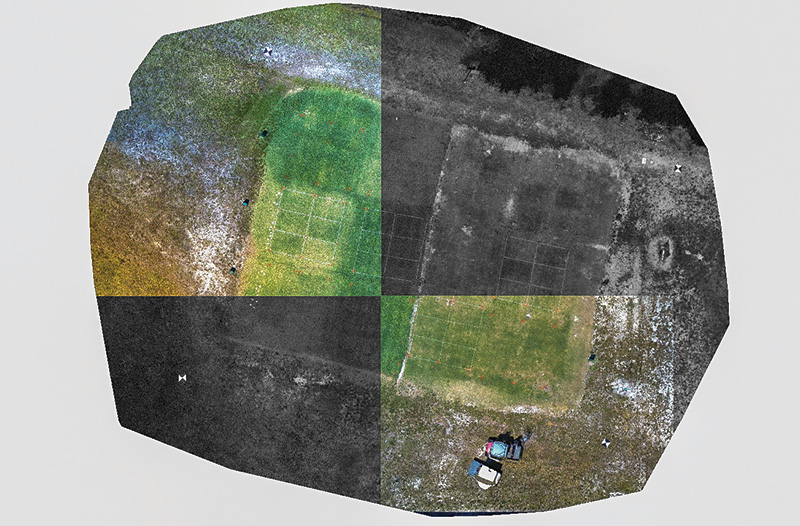
Figure 2. Orthomosaic reflectance map generated using Pix4D from aerial RGB imagery collected via unmanned aerial system (UAS). Each grayscale image represents the spatial distribution of reflectance in the blue spectral band, where pixel intensity corresponds to the relative reflectance of that wavelength. Higher reflectance values appear lighter, indicating stronger reflectance in that specific band.
Materials and methods
Study site preparation
This experiment took place alongside a reclaimed effluent experiment being conducted at the University of Florida’s Fort Lauderdale Research and Education Center and consisted of three monthly drone flights in February, March and April 2023 over the project area to assess changes in the turf plots over the winter season. CitraBlue St. Augustinegrass and Celebration bermudagrass were planted in February 2021, and the research plots were completely established by the time of this study. These grasses were evaluated every two weeks for visual turf quality on a 1-to-9 scale (6), and NDVI readings were recorded. Fertilization treatments mimicked current recommendations for turfgrass fertilization when fresh water is used for irrigation in South Florida and included both lower (3 pounds nitrogen per 1,000 square feet per year/148 kilograms per hectare per year) and higher (6 pounds nitrogen per 1,000 square feet per year/293 kilograms per hectare per year) nitrogen rates for St. Augustinegrass plots and just one nitrogen rate (7 pounds nitrogen per 1,000 square feet per year/342 kilograms per hectare per year) for bermudagrass. In both species, a nonfertilized control was included. The two fertilizer rates for St. Augustinegrass were both applied using a 30-0-10 Polyon controlled-release fertilizer (Harrell's, 90% slow-release nitrogen), while for bermudagrass, fertilizer was applied either as ammonium sulfate (21-0-0) or as a controlled-release fertilizer (42-0-0 Polyon).
Image analysis and stitching
Images obtained in this study were captured using a Parrot ANAFI Thermal drone (Parrot) equipped with a CMOS 1/2.4-inch camera with 21 megapixels, an f/2.4 aperture and sensors that capture electromagnetic radiation in the RGB bands (Figure 1). Flight planning was done in Pix4D mobile, and flight parameters were calculated based on sensor information and the desired spatial resolution on the ground sampling distance, which was sub-centimeter for the purpose of this study. Flight schedules were set between 10 a.m. and 2 p.m. EST for consistent sun exposure during photo recordings. The establishment of four permanent ground control points of known geographic locations around the study site using real-time kinematics was done on Feb. 19, 2023. Orthomosaic photos were constructed using Pix4D, and VIs were computed using QGIS (v3.30.1) software, calculating R, G and B index values as averages across the surface areas of the plots (Figure 2).
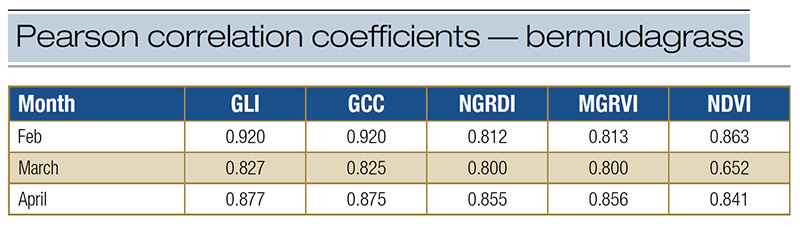
Table 1. Pearson correlation coefficients of Celebration bermudagrass for various vegetation indices against visual quality ratings, broken down by species and month. All correlations presented were significant at P < 0.05. Values closer to 1 are considered highly correlated.
Results and discussion
MRBVI failed to significantly correlate with any quality readings in either species over the duration of the study and has been excluded from the results. VIs that were more correlative with visual quality than NDVI were different for each species of grass observed, along with variations in those correlations at different points in time. Bermudagrass quality was strongly correlated with indices that focused on the overrepresentation of green light, such as GLI and GCC (Table 1). These indices all focus on the proportion that green light represents of the total visible spectrum. However, these same indices were never capable of outperforming NDVI’s correlation with the visual quality of St. Augustinegrass (Table 2). It can be inferred that bermudagrass and St. Augustinegrass have completely different reflectance signatures, as different indices were found to be the most suitable for each grass observed. While GLI and GCC were closely tied to visual quality for both grass species, only bermudagrass visual ratings were found to be consistently correlated with NGRDI and MGRVI. Both indices focus on the difference between the two light bands, green and red, and were found to exhibit weak correlations with the visual quality of St. Augustinegrass.
The marginal differences observed between Pearson correlation coefficients for various VIs highlight the similarities in their performance, despite differences in calculation methods. These findings suggest that, while certain indices may offer slight improvements in monitoring methods, the overall performance is largely comparable. It is important to note, however, that these similarities could be influenced by environmental conditions, dataset artifacts or noise specific to this study.
Consumer-grade technology and minimal processing can provide meaningful insights into turfgrass health. These tools offer an accessible and practical starting point for vegetation monitoring, even for users with limited technical expertise.
Turfgrass acts as an ideal crop to monitor with UAS due to the lack of shadows or artifacts associated with its aerial photography. The small leaf blades provide minute shadows, and the grass itself is not prone to movement due to wind while photos are being taken, allowing for smooth stitching and clear orthomosaic photos. It remains possible that preemptively applying fixed camera settings to the UAS before flights, or postprocessing of photos captured, might create more homogenous and useful reflectance maps.
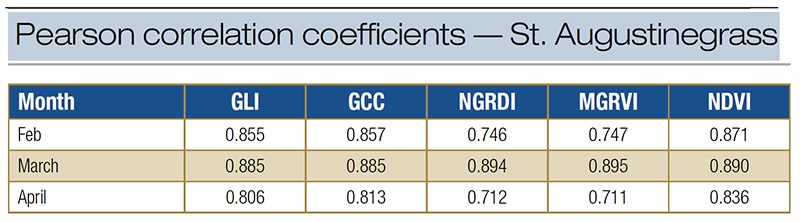
Table 2. Pearson correlation coefficients of CitraBlue St. Augustinegrass for various vegetation indices against visual quality ratings, broken down by species and month. All correlations presented at significant at P < 0.05. Values closer to 1 are considered highly correlated. < 0.05. Values closer to 1 are considered highly correlated.
Conclusion
Most of the RGB indices in this study (GLI, GCC, NGRDI and MGRVI) have the potential to be more accurate than NDVI when evaluating bermudagrass performance. Only GCC and GLI were competitively viable compared to NDVI in St. Augustinegrass. These differences are essential to understand, as both species of grass were unique in growth habit, height of cut and fertilizer regimen, which implies that their color responses to inputs were unique and needed to be evaluated independently of one another.
The two different grass species in this study yielded their own correlations to various RGB indices against turf quality, which may imply that the “best” index for a given study will likely rely on the crop being grown and even perhaps the cultivar. A preliminary assessment to determine which index would be most suitable for researchers using RGB cameras to monitor crops would be essential to get good data.
The research says
- Indices show different correlations for different warm-season turfgrass species.
- Normalized Difference Vegetation Index correlates best with the visual quality of St. Augustinegrass.
- Bermudagrass quality was correlated with indices that focused on the representation of green light.
Acknowledgments
This research was made possible by grants from the USDA National Institute of Food and Agriculture Hatch project FLA FTL 005959 and the Florida GCSA.
Literature cited
- Bendig, J., K. Yu, H. Aasen, A. Bolten, S. Bennertz, J. Broscheit, M.L. Gnyp and G. Bareth. 2015. Combining UAV-based plant height from crop surface models, visible, and near infrared vegetation indices for biomass monitoring in barley. International Journal of Applied Earth Observation and Geoinformation 39:79-87 (https://doi.org/10.1016/j.jag.2015.02.012).
- Bremer, D.J., H. Lee, K. Su and S.J. Keeley. 2011. Relationships between normalized difference vegetation index and visual quality in cool-season turfgrass: II. Factors affecting NDVI and its component reflectances. Crop Science 51(5):2219-2227 (https://doi.org/10.2135/cropsci2010.12.0729).
- Fitz-Rodríguez, E., and C.Y. Choi. 2002. Monitoring turfgrass quality using multispectral radiometry. Transactions of the ASAE 45(3):865-871 (https://doi.org/10.13031/2013.8839).
- Louhaichi, M., M.M. Borman and D.E. Johnson. 2001. Spatially located platform and aerial photography for documentation of grazing impacts on wheat. Geocarto International 16(1):65-70 (https://doi.org/10.1080/10106040108542184).
- Marín, J., S. Yousfi, P.V. Mauri, L. Parra, J. Lloret and A. Masaguer. 2020. RGB vegetation indices, NDVI, and biomass as indicators to evaluate C3 and C4 turfgrass under different water conditions. Sustainability 12(6) Article 2160 (https://doi.org/10.3390/su12062160).
- Morris, K.N., and R.C. Shearman. 1999. NTEP turfgrass evaluation guidelines. National Turfgrass Evaluation Program.
- Reid, A.M., W.K. Chapman, C.E. Prescott and W. Nijland. 2016. Using excess greenness and green chromatic coordinate colour indices from aerial images to assess lodgepole pine vigour, mortality and disease occurrence. Forest Ecology and Management 374:146-153 (https://doi.org/10.1016/j.foreco.2016.05.006).
Marco Schiavon, Ph.D., (marcoschiavon@ufl.edu) is an assistant professor, and Patrick H. McLoughlin is a graduate student, both in the Environmental Horticulture Department, Fort Lauderdale Research and Education Center, University of Florida, Davie.