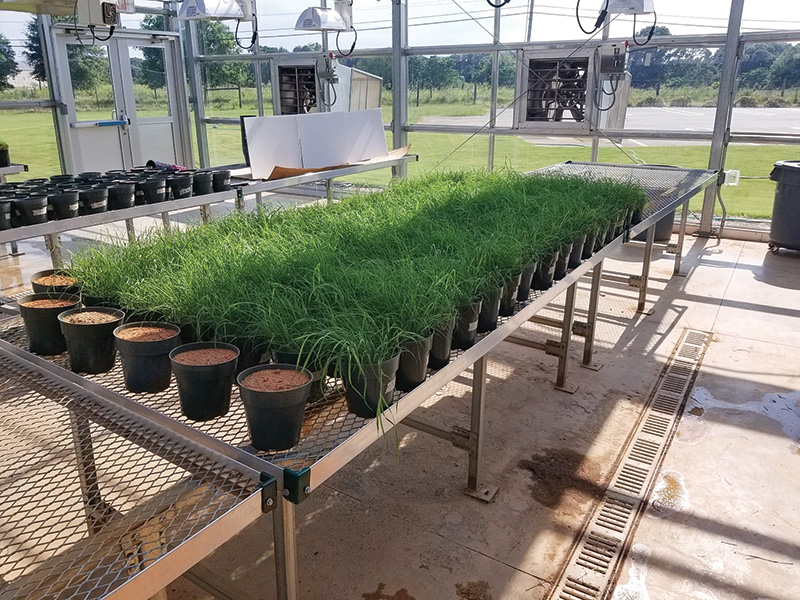
Figure 1. Greenhouse experiments were conducted to determine the impact of microbial inoculants on the establishment of Sahara II bermudagrass from seed. Photos by Gerald M. Henry
Bermudagrass (Cynodon spp.) is one of the most widely used turfgrass species in the southeastern region of the United States due to the production of a dense turfgrass canopy that tolerates excessive wear and traffic. Consequently, bermudagrass is one
of the largest nitrogen consumers, requiring approximately 22 to 44 pounds nitrogen per acre (24.7 to 49.3 kilograms per hectare) per month during the growing season (4). Access to fertility is extremely important, because nitrogen is a component
of numerous plant biochemical constituents including chlorophyll, amino acids and the enzymes that are integral to turfgrass growth and metabolic function (1).
Fertilizers are costly and may negatively influence the environment when misapplied at excessive rates or by improper techniques. The Haber-Bosch process is an industrial nitrogen fixation procedure that is mainly responsible for the current synthetic
production of ammonia (6). Ammonia generated by this reaction is predominantly used as nitrogen fertilizer in the form of ammonium nitrate and urea. However, the potential environmental impacts resulting from this production process and subsequent
fertilizer application include: nitrogen leaching or runoff, leading to groundwater contamination and eutrophication; atmospheric deposition of nitrates and ammonia; and increased greenhouse gas emissions, including nitrous oxide (8).
Current turfgrass sustainability research has aimed to investigate alternatives to traditional nitrogen fertilizer applications to limit negative environmental impacts. Biostimulants include an assortment of microbial and nonmicrobial products that are
intended to enhance plant nutrition, establishment and growth, and stress tolerance (2). Previous research involving microbial biostimulants in turfgrass systems has been limited and inconsistent. Although microbial inoculants are more widely adopted
for use in horticultural and agronomic crops, several challenges exist regarding their use and efficacy, with some more specific to turfgrass systems. Most commercial products contain foreign microorganisms that have difficulty competing with native
populations acclimated to regional environmental conditions (7). Turfgrass management inputs such as fertilizer, pesticides and irrigation, as well as environmental issues such as turfgrass species and the soil profile composition, can select for
more adaptive microbial communities that quickly outcompete introduced organisms (5). Previous research evaluating microbial inoculants in turfgrass has primarily focused on cool-season turfgrass species, with a majority of research conducted in controlled
environments. Furthermore, limited information still exists regarding the application timing, carrier volume, water quality, inoculation size and need for sequential applications in turfgrass environments.
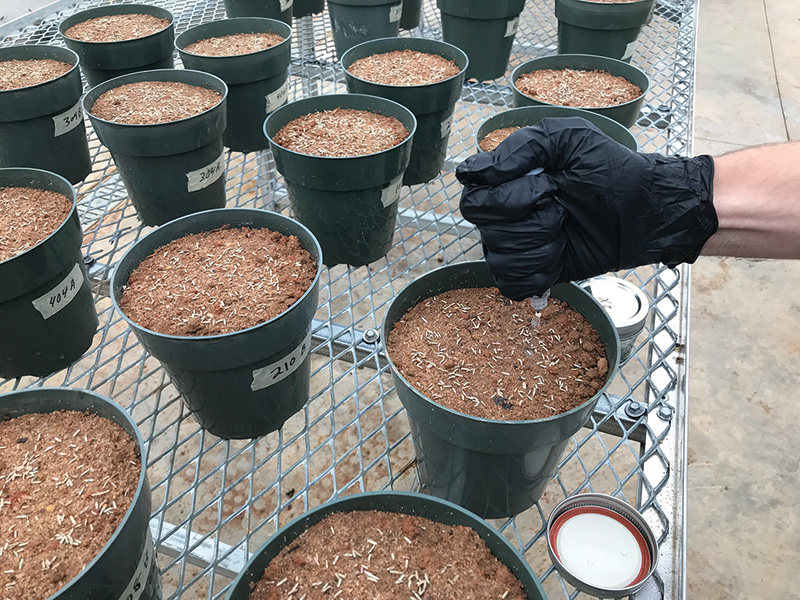
Figure 2. Microbial inoculants were applied evenly over the surface of each pot using a syringe.
Materials and methods
Field experiments
Trials were conducted in 2021 at the Athens Turfgrass Research and Education Center (ATREC) in Athens, Ga., and a residential lawn (BO) in Bogart, Ga. Soil nutrient status and organic matter content was determined for each location. Research at ATREC
and BO was performed on a 5-year-old and 2-year-old Tifway hybrid bermudagrass, respectively, each maintained at 2 inches (5.1 centimeters). Treatments were initiated on July 5, 2021, at ATREC and July 21, 2021, at BO and included single and sequential
applications of Klebsiella variicola 137–1036 Formulation 1 (KLEB1) at an inoculant rate of 0.2 gallons per acre (1.87 liters per hectare) (1.2 × 10¹⁰ colony-forming units per fluid ounce/29.6 milliliters) and a carrier volume of 321 gallons
per acre (3,003 liters per hectare); Klebsiella variicola 137–1036 Formulation 2 (KLEB2) at an inoculant rate of 0.2 gallons per acre (1.2 × 10¹⁰ colony-forming units per fluid ounce) and a carrier volume of 321 gallons per acre; Gluconacetobacter
diazotrophicus (GLUC) at an inoculant rate of 0.1 gallons per acre (0.94 liters per hectare) (3 × 10⁸ colony-forming units per fluid ounce) and a carrier volume of 20 gallons per acre (187 liters per hectare); and Azospirillum brasilense (AZOS)
at an inoculant rate of 0.27 gallons per acre (2.53 liters per hectare) (6 × 10⁶ colony-forming units per fluid ounce) and a carrier volume of 96 gallons per acre (898 liters per hectare). Sequential applications were made three weeks after
initial treatment (WAIT). A non-treated check was included for comparison. Microbial inoculants were applied in distilled water with a watering can. No fertilizer was applied to either site during the duration of each trial.
Turfgrass color (TC), turfgrass quality (TQ) and normalized difference vegetation index (NDVI) were recorded at trial initiation, and at 2, 6 and 8 WAIT. Visual ratings of TC and TQ were recorded on a scale of 1 to 9, with a rating of 6 considered to
be acceptable for TC and TQ. Measurements of carbon efflux (CX) (micromole per square meter per second; µmol m-2 s-1) were recorded at trial initiation and at 4 and 8 WAIT with a LI-COR 8100A automated system to determine plant root and soil
microbial respiration as well as the overall metabolic activity of each system (3). Change over time (Δ) for CX was determined at 4 and 8 WAIT by comparing readings at each date with initial measurements.
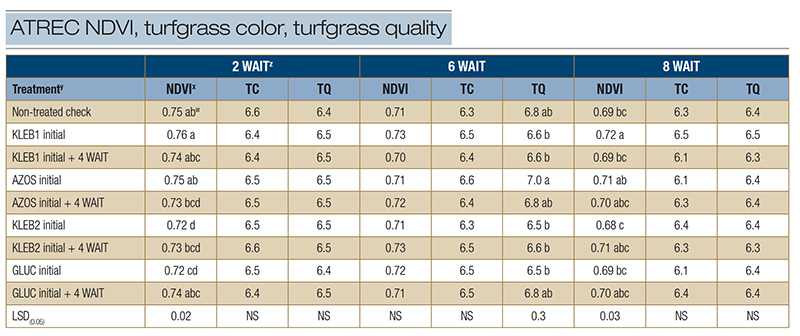
Table 1. Normalized difference vegetation index (NDVI), turfgrass color (TC) and turfgrass quality (TQ) of mature Tifway hybrid bermudagrass in response to microbial inoculants applied at the Athens Turfgrass Research and Education Center during the summer of 2021 in Athens, Ga.
zAbbreviations: LSD, least significant difference; NS, not significant; WAIT, weeks after initial treatment. y: Microbial inoculants were applied in distilled water with a watering can. x: The NDVI was recorded with a Field Scout CM 1000 NDVI chlorophyll meter. The vegetative index was calculated from the reflectance readings on a scale of 0 to 1, where 1 is best. An average of three readings was obtained per plot per rating date. Visual ratings of TC and TQ were recorded on a scale of 1 to 9, with a rating of 6 considered to be acceptable. w: Means within a column followed by the same lowercase letter are not significantly different.
Greenhouse experiments
Trials were conducted at the ATREC greenhouse complex in Athens, Ga., during the summer of 2021 (Figure 1). On July 26, 2021, Sahara II common bermudagrass (non-treated) was seeded at a rate of 87 pounds per acre (98 kilograms per hectare) into circular
pots containing a 2:1 mixture of a Cecil sandy clay loam and a Wakulla sand. Two pots were established per treatment per trial replication in order to conduct a time-lapse destructive harvest at 3 and 6 weeks after seeding (WAS). A stock solution
of each microbial inoculant was prepared with distilled water to deliver the same eight treatments as described previously for the field experiments. The inoculants were applied evenly across the surface of each pot on July 26, 2021, with a syringe
(Figure 2). Treatments receiving sequential applications were initiated on August 16, 2021. The pots were irrigated after inoculant application to move treatments into the soil. A non-treated check was included for comparison. Conditions in the climate-controlled
greenhouse were maintained at day/night temperatures of 89/79 F (32/26 C). Pots were destructively harvested at 3 and 6 WAS. Roots and shoots were separated from each other, washed from all soil, dried in an oven for 48 hours at 230 F (110 C) and
weighed to determine root and shoot biomass (ounces) at 3 and 6 WAS.
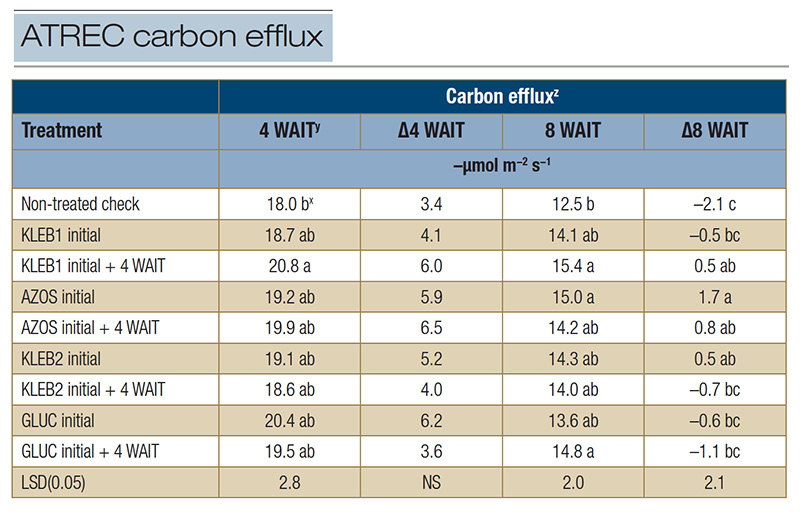
Table 2. Carbon efflux of mature Tifway hybrid bermudagrass in response to microbial inoculants applied at the Athens Turfgrass Research and Education Center during the summer of 2021 in Athens, Ga.
z: Carbon efflux measurements were recorded with a LI-COR 8100A automated system at trial initiation as well as 4 and 8 WAIT to provide insight into plant and soil microbial activity (respiration). Data recorded at 4 and 8 WAIT were compared with data recorded at trial initiation in order to calculate the carbon efflux change over time (Δ).
y: Abbreviations: LSD, least significant difference; NS, not significant; WAIT, weeks after initial treatment. x: Means within a column followed by the same lowercase letter are not significantly different.
Results
Field experiments
ATREC location
Significant differences in NDVI were observed among treatments 2 WAIT; however, no microbial inoculant treatment resulted in statistically greater NDVI ratings than the non-treated check (Table 1). Turfgrass color and TQ 2 WAIT ranged from 6.4 to 6.6
and 6.4 to 6.5, respectively; however, no significant differences were observed among treatments. No significant differences were observed in response to microbial inoculant treatments for NDVI (0.70-0.73) and TC (6.3-6.6) 6 WAIT, regardless of treatment
(Table 1). Microbial inoculant treatments did not exhibit statistically greater TQ scores than the non-treated check (6.8) 6 WAIT; however, single and sequential applications of AZOS resulted in TQ scores of 6.8 to 7.0, whereas TQ in response to sequential
applications of GLUC was 6.8. At 8 WAIT, no significant differences were observed among treatments for TC (6.1-6.5) and TQ (6.3-6.5) ratings (Table 1). A single application of KLEB1 resulted in the highest NDVI rating (0.72), followed by single and
sequential applications of AZOS (0.70-0.71), sequential applications of KLEB2 (0.71) and sequential applications of GLUC (0.70).
Although no significant differences were observed among treatments for CX 4 WAIT (ΔCX = 3.4 to 6.5 µmol m−2 s−1, regardless of the treatment), respiration measurements increased compared with the readings at trial initiation (Table
2). The ΔCX for the non-treated check (-2.1 µmol m−2 s−1) was not only negative but was the lowest among the treatments 8 WAIT (Table 2). The highest ΔCX readings 8 WAIT were observed in response to single and sequential
applications of AZOS (1.7 and 0.8 µmol m−2 s−1, respectively), followed by sequential applications of KLEB1 (0.5 µmol m−2 s−1) and single applications of KLEB2 (0.5 µmol m−2 s−1).
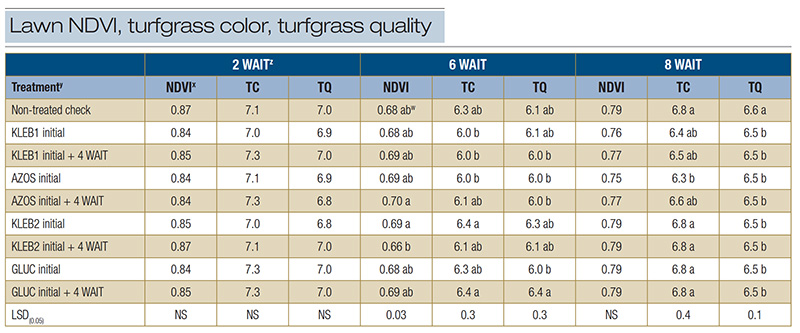
Table 3. Normalized difference vegetation index (NDVI), turfgrass color (TC) and turfgrass quality (TQ) of mature Tifway hybrid bermudagrass in response to microbial inoculants applied at a home lawn in Bogart, Ga., during the summer of 2021.
z: Abbreviations: LSD, least significant difference; NS, not significant; WAIT, weeks after initial treatment. y: Microbial inoculants were applied in distilled water with a watering can. x: The NDVI was recorded with a Field Scout CM 1000 NDVI chlorophyll meter. The vegetative index was calculated from the reflectance readings on a scale of 0 to 1, where 1 is best. An average of three readings was obtained per plot per rating date. Visual ratings of TC and TQ were recorded on a scale of 1 to 9, with a rating of 6 considered to be acceptable. w: Means within a column followed by the same lowercase letter are not significantly different.
BO location
No statistical differences were observed among treatments for NDVI (0.84-0.87), TC (7.0-7.3) and TQ (6.8-7.0) 2 WAIT (Table 3). Sequential applications of AZOS resulted in the highest NDVI (0.70) 6 WAIT, but no statistical differences were observed between
microbial inoculant treatments and the nontreated check (0.68) (Table 3). Single applications of KLEB2 and sequential applications of GLUC exhibited the highest TC (6.4) and TQ (6.3 and 6.4, respectively) 6 WAIT. However, TC and TQ for the non-treated
check (6.3 and 6.1, respectively) 6 WAIT were statistically similar. No statistical differences were observed among treatments with respect to NDVI (0.75-0.79) 8 WAIT (Table 3). The non-treated check resulted in similar or greater TC (6.8) and TQ
(6.6) ratings than all microbial inoculant treatments 8 WAIT.
The non-treated check resulted in the greatest reduction in CX (-5.6 µmol m−2 s−1) 4 WAIT; however, a negative ΔCX was observed in response to all microbial inoculant treatments (Table 4). The ΔCX at 4 WAIT in response to
single applications of GLUC (-1.3 µmol m−2 s−1), single and sequential applications of AZOS (-1.6 and -1.4 µmol m−2 s−1, respectively), and single applications of KLEB2 (-2.1 µmol m−2 s−1) were
statistically greater than those of the non-treated check 4 WAIT. Carbon efflux measurements continued to decrease 8 WAIT, regardless of the treatment; however, sequential applications of KLEB2 (-4.3 µmol m−2 s−1), single applications
of GLUC and AZOS (-4.8 µmol m−2 s−1) and single applications of KLEB2 (-5.7 µmol m−2 s−1) resulted in the smallest reductions in CX (Table 4). Negative ΔCX measurements at this site may have been related to
soil moisture. Although 13 inches of rainfall was recorded over the trial duration, soil moisture may have been inadequate during CX measurements, because rainfall did not occur programmatically, as was the case at the irrigated ATREC site.
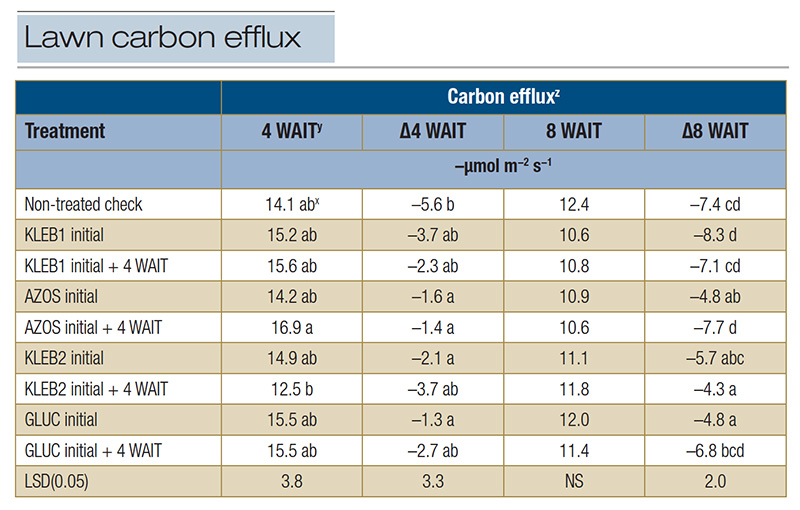
Table 4. Carbon efflux of mature Tifway hybrid bermudagrass in response to microbial inoculants applied at a home lawn in Bogart, Ga., during the summer of 2021.
z: Carbon efflux measurements were recorded with a LI-COR 8100A automated system at trial initiation as well as 4 and 8 WAIT to provide insight into plant and soil microbial activity (respiration). Data recorded at 4 and 8 WAIT were compared with data recorded at trial initiation in order to calculate the carbon efflux change over time (Δ). y: Abbreviations: LSD, least significant difference; NS, not significant; WAIT, weeks after initial treatment. x: Means within a column followed by the same lowercase letter are not significantly different.
Greenhouse experiments
In Experimental Run 1, significant differences were observed for root weight (0.008 to 0.013 ounces/.23 to .37 grams) 3 WAS; however, no microbial inoculant treatment resulted in statistically greater root weight than the non-treated check (0.011 ounces/.32
grams) (Table 5). No statistical differences were observed with respect to shoot weight (0.025 to 0.034 ounces/.71 to .96 grams) 3 WAS. The greatest amount of root weight 6 WAS was observed in response to sequential applications of KLEB1 (0.121 ounces/3.43
grams), followed by the non-treated check (0.119 ounces/3.37 grams) and single applications of AZOS (0.118 ounces/3.35 grams) (Table 5). Single applications of KLEB1 resulted in the greatest amount of shoot weight (0.252 ounces/7.14 grams) 6 WAS;
however, the shoot weight of the nontreated check (0.189 ounces/5.36 grams) was statistically similar. Root and shoot weights at 3 and 6 WAS in Experimental Run 2 were less than the weights observed in Run 1, regardless of the treatment. No significance
was observed with respect to root and shoot weights in Experimental Run 2, regardless of the harvest date. Additionally, root and shoot weights in Run 2 were less than those observed in Run 1, regardless of treatment (Table 5). Differences in biomass
between runs may be attributed to the position of each trial within their greenhouses. Although both trials received the same amount of irrigation, Run 2 may have dried out more quickly than Run 1 because it was closer to the greenhouse fans instead
of the cooling pads.
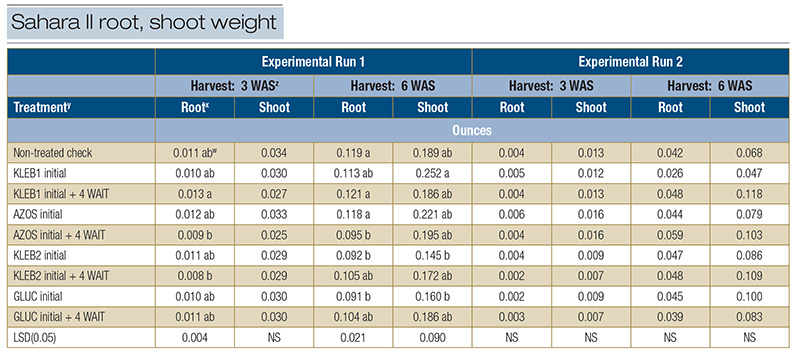
Table 5. Root and shoot weight of seeded Sahara II common bermudagrass in response to microbial inoculants applied in the greenhouse during the spring of 2021 in Athens, Ga.
z: Abbreviations: LSD, least significant difference; NS, not significant; WAS, weeks after seeding. y: Microbial inoculants were applied in distilled water with a syringe.
x: Roots and shoots were separated from each other, washed free from all soil, dried in an oven for 48 hours at 230 F (110 C), and weighed to determine root and shoot biomass (ounces).
wMeans within a column followed by the same lowercase letter are not significantly different.
Conclusions
Microbial inoculant applications did not consistently increase hybrid bermudagrass NDVI, TC, TQ and CX in the field or common bermudagrass root and shoot biomass in the greenhouse. However, thicker roots were observed in response to several microbial
inoculant treatments, suggesting colonization was occurring. Perennial cropping systems such as turfgrass may create greater challenges for microbial inoculant use and performance. Endemic microbial populations that have adapted to survive and proliferate
in turfgrass environments may outcompete nonendemic microorganisms recently introduced into the system. Furthermore, cultural practices (e.g., aerification and topdressing) and management inputs (e.g., fertilizer, irrigation and pesticides) specific
to turfgrass growth and production may influence microbial activity, persistence and species diversity through physical and chemical manipulation of the soil. Turfgrass species may also play a critical role in symbiotic relationships between plant
roots and soil microorganisms. The relevance of previous field research may be limited because most research trials only lasted a few months. Future research should examine inoculation frequency, soil and plant persistence, and the use of microbial
blends to determine best management practices leading to the greatest opportunity for colonization and subsequent turfgrass benefits.
The Research Says:
- Microbial inoculant applications did not consistently increase hybrid bermudagrass normalized difference vegetation index, turfgrass color, turfgrass quality and carbon efflux in the field or common bermudagrass root and shoot biomass in the
greenhouse.
- Thicker roots were observed in response to several microbial inoculant treatments, suggesting that colonization was occurring.
- Endemic microbial populations that have adapted to survive and proliferate in turfgrass environments may outcompete nonendemic microorganisms recently introduced into the system.
- Cultural practices (e.g., aerification and topdressing) and management inputs specific to turfgrass growth and production may influence microbial activity, persistence and species diversity through physical and chemical manipulation of the soil.
Literature cited
- Christians, N.E., A.J. Patton and Q.D. Law. 2016. Fundamentals of turfgrass management. John Wiley & Sons, Hoboken, N.J.
- Du Jardin, P. 2015. Plant biostimulants: Definition, concept, main categories and regulation. Scientia Horticulturae 196:3-14 (https://doi.org/10.1016/j.scienta.2015.09.021).
- Henry, G.M., W.J. Bowling and K.A. Tucker. 2021. Comparing conventional aerification practices with the core recycler. International Turfgrass Science Research Journal 14(1):1-7 (https://doi.org/10.1002/its2.86).
- McCarty, L.B., and G. Miller. 2002. Managing bermudagrass turf: Selection, construction, cultural practices and pest management strategies (first edition). John Wiley & Sons, Hoboken, N.J.
- Shi, W., D. Bowman and T. Rufty. 2007. Soil microbial community composition and function in turfgrass ecosystems. Bioremediation, Biodiversity and Bioavailability 1:72-77.
- Smith, C., A.K. Hill and L. Torrente-Murciano. 2020. Current and future role of Haber–Bosch ammonia in a carbon-free energy landscape. Energy & Environmental Science 13(2):331-344 (https://doi.org/10.1039/C9EE02873K).
- Timmusk, S., L. Behers, J. Muthoni, A. Muraya and A.C. Aronsson. 2017. Perspectives and challenges of microbial application for crop improvement. Frontiers in Plant Science 8:49 (https://doi.org/10.3389/fpls.2017.00049).
- Xu, R., H. Tian, S. Pan, S.A. Prior, Y. Feng, W.D. Batchelor, J. Chen and J. Yang. 2019. Global ammonia emissions from synthetic nitrogen fertilizer applications in agricultural systems: Empirical and process-based estimates and uncertainty. Global
Change Biology 25(1):314-326 (https://doi.org/10.1111/gcb.14499).
Gerald M. Henry, Ph.D., (gmhenry@uga.edu) is the athletic association endowed professor of environmental turfgrass science; Connor Bolton, M.S., is a former graduate student; Miguel L. Cabrera, Ph.D., is the Georgia Power professor in environmental remediation and soil chemistry; Mussie Habteselassie, Ph.D., is a professor of soil microbiology; and Kevin A. Tucker, M.S., is a research assistant, all at the University of Georgia, Athens