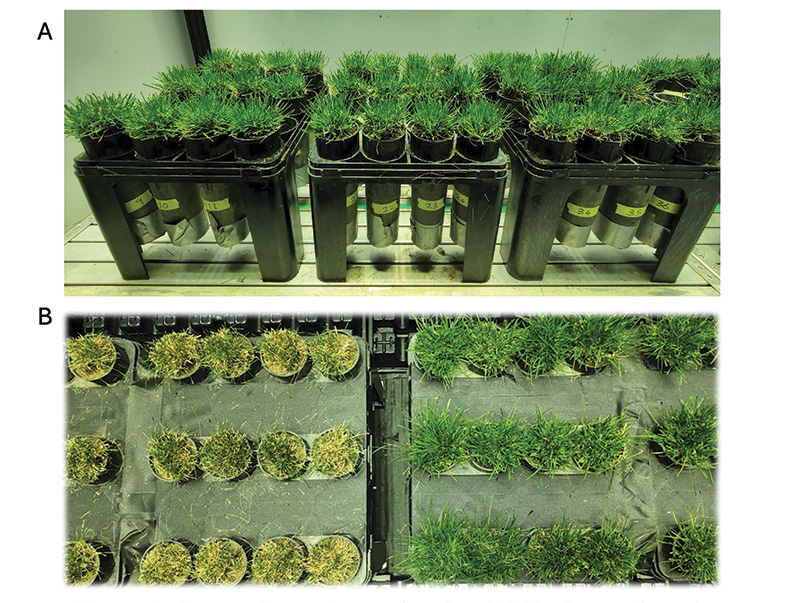
Setup of experiment showing (top) turfgrass plants in the dynamic environment photosynthetic imaging chamber to be exposed to drought (left side of bottom photo) and well-watered conditions (right side of bottom photo). Photos by Michael Itam
For cool-season grasses using the C3 photosynthetic pathway, major physiological responses to drought can include stomatal closure that restricts transpiration and carbon dioxide entry, cessation of photosynthetic processes and growth, and damage to photosynthetic machinery. These responses restrict photosynthesis and therefore the creation of carbohydrates, which are essential building blocks for turfgrass root and shoot growth and energy production. Drought-resistant turfgrasses that can maintain cellular water levels and health of photosynthetic machinery, and therefore green color and growth, are desirable in many regions. In this research, we focused on obtaining a better understanding of the potential damage and stress-protection mechanisms that cool-season grasses may have to protect photosynthetic machinery during drought stress responses.
Chlorophyll reflectance measurements can be good indicators of the health of photosynthetic machinery. The commonly measured parameter related to photosynthetic health in turfgrass research studies has been the maximum quantum yield of photosystem II (PSII) or often called photochemical efficiency in turfgrass literature (Fv/Fm) (4). PSII is the first photosystem in the light reactions of photosynthesis in chloroplasts. While Fv/Fmis informative for understanding turfgrass plant and environmental interactions, it has major limitations in many studies. For instance, it has not been very responsive to early drought in many experiments, and differences in Fv/Fm in response to drought stress may not be visible until mid to later stages of drought incidence, if at all (3, 5). Therefore, the objective of this study was to evaluate the utility of other photosynthetic health traits that may be earlier indicators or more sensitive in detecting drought responses and photosynthetic health. A set of traits, known as non-photochemical quenching (NPQ) associated traits, are plant mechanisms that can reduce damage to PSII and allow for the removal of excess energy. When plant processes shut down or start to be damaged by stress, it is important for plants that are still under high light conditions to be able to deal with excess light to prevent that excess light from damaging structures, mostly due to oxidative stress.
This study aimed to determine if NPQ measurements are valuable to differentiate drought stress responses of various varieties of Kentucky bluegrass, which are more resistant to drought conditions, compared to varieties of the more drought-sensitive cool-season species, perennial ryegrass. We expected that NPQ measurements may be more sensitive and more responsive to drought stress compared to Fv/Fm, particularly for the more sensitive species and varieties.

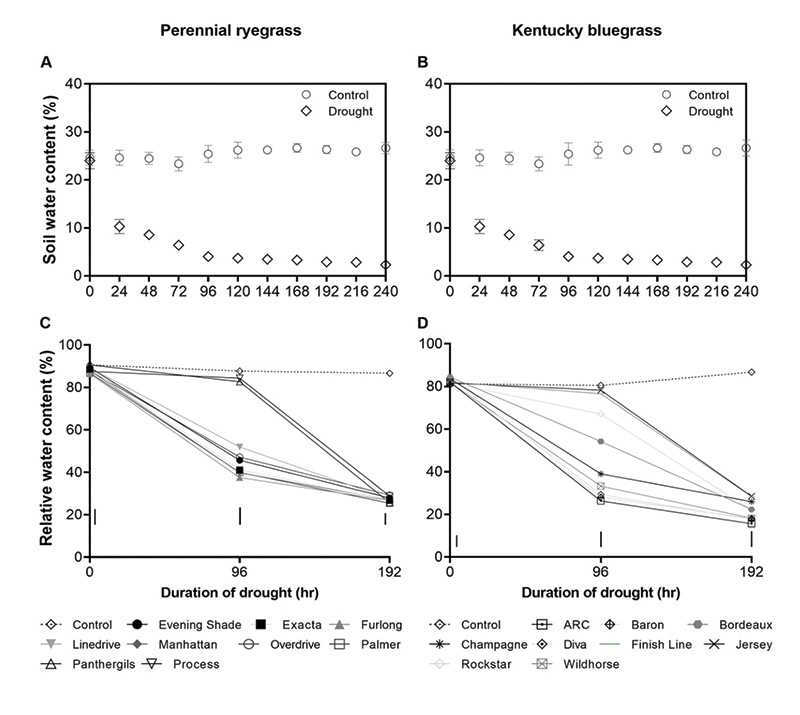
Figure 1. Soil volumetric water content for (A) perennial ryegrass and (B) Kentucky bluegrass and leaf relative water content for (C) perennial ryegrass and (D) Kentucky bluegrass cultivars in pots in a growth chamber treated with either well-watered (control) or drought condition. Dashed lines represent values for well-watered control conditions. Differences among cultivar means were detected using Fisher’s least significant difference (LSD) test at P ≤ 0.05. Vertical bars indicate LSD values.
Methods
Nine cultivars from each of two turfgrass species, perennial ryegrass and Kentucky bluegrass, were used for this study. The perennial ryegrass cultivars used were Evening Shade, Exacta, Furlong, Linedrive, Manhattan, Overdrive, Palmer, Panther GLS and Process. The Kentucky bluegrass cultivars used were ARC, Baron, Bordeaux, Champagne, Diva, Finish Line, Jersey, Rockstar and Wildhorse. These cultivars of each species were expected to exhibit variation in drought responses based on evaluations within the National Turfgrass Evaluation Program in 2017.
A total of 72 deep pots (2.36-inch diameter by 13.78-inch depth/6 by 35 centimeters) were seeded with each variety in sandy loam soil (65.9% sand, 14.9% silt, 19.2% clay) with eight replicates of each variety in a greenhouse in East Lansing, Mich. Once established, plants were transferred to a growth chamber containing specialized, programmable lighting and sensors called a dynamic environment photosynthesis imager (DEPI) chamber (2). The experiment was repeated for a total of two experimental runs in 2022. The DEPI chamber was maintained at optimum temperature (77 F/66 F [25 C/19 C] day/night), with relative humidity 40%/50% day/night, photosynthetic photon flux density 950 micromoles per square meter per second and photoperiod 14 hours. Plants were allowed to acclimate to the DEPI chamber for five days prior to drought treatment. Drought stress was induced by withholding water on four randomly selected replicate plants of each cultivar, whereas well-watered control plants were irrigated with 25 milliliters of deionized water daily.
Soil volumetric water content was monitored daily using a soil moisture meter (TDR 100; Spectrum Technologies, Aurora, Ill.) with 3-inch (7.6-centimeter) probes. Leaf relative water content (RWC) was determined on leaf samples clipped from plants on zero, four and eight days of water treatment (1). The DEPI chamber lighting system was programmed to measure various parameters, including Fv/Fm and NPQ (2). All data was statistically analyzed as appropriate.

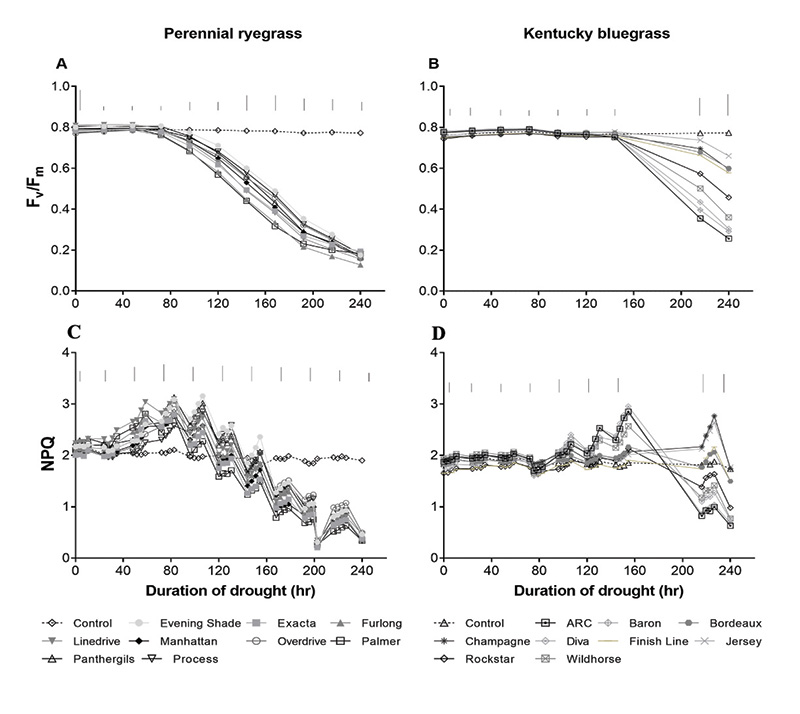
Figure 2. (A, B) Maximum quantum yield of photosystem II (Fv/Fm) and (C,D) non-photochemical quenching (NPQ) of perennial ryegrass (left) and Kentucky bluegrass (right) cultivars during well-watered (control) and drought treatment in a growth chamber for 10 days (240 hours). Dashed lines indicate the mean for well-watered controls and solid lines indicate mean for drought-treated plants. Vertical bars indicate Fisher’s least significant difference between cultivars on respective days (P ≤ 0.05).
Results and discussion
Soil water content and leaf RWC decreased in all turfgrasses in response to drought treatment, but the rate of decrease varied among the cultivars (Figure 1). On Day 4 after drought treatment, three perennial ryegrass cultivars — Process, Panther GLS and Linedrive — had higher RWC compared to the other perennial ryegrass cultivars, among which Furlong and Palmer had the lowest values (Figure 1). On Day 8, there was no significant difference among cultivars. Among the Kentucky bluegrass cultivars, on Day 4, Finishline, Jersey, Bordeaux and Rockstar had significantly higher RWC compared to cultivars like ARC, Diva and Baron. On Day 8, Jersey and Finishline had a higher RWC than other cultivars.
In the well-watered condition, Fv/Fm and NPQ remained relatively unchanged and were not different between species (Figure 2). Drought stress influenced all photosynthetic health parameters that were measured, including Fv/Fm and NPQ. Fv/Fm decreased below control levels due to drought stress starting around 90 hours in perennial ryegrass and 140 hours in Kentucky bluegrass. This illustrates the greater drought resistance of Kentucky bluegrass. Among perennial ryegrass cultivars, Evening Shade, Process and Panther GLS had higher values compared to Furlong and Palmer at most time points. Kentucky bluegrass Jersey, Champaign, Bordeaux and Finish Line had higher Fv/Fm values than ARC, Baron and Diva at most time points.
Similar varietal differences were found by measuring NPQ. During the early to mid-drought phase for NPQ for perennial ryegrass, Evening Shade, Overdrive and Process had higher values than Palmer and Exacta at most time points. During the late drought phase, Overdrive had higher values than Palmer at most time points, whereas other cultivars had similar values and fell between Overdrive and Palmer. For Kentucky bluegrass cultivars during early to mid-drought stress, Diva, Baron and Wildhorse had higher NPQ values than other cultivars, whereas, during late drought, Champaign, Jersey, Bordeaux and Finish Line had higher values than other cultivars, with ARC, Baron and Diva having the lowest values.
The NPQ values increased above control levels in response to early to mid-drought stress and then decreased in response to more severe drought stress. This increase in NPQ indicates a stress response or stress protection activation phase that was able to be observed with NPQ but not with Fv/Fm. It indicates the plant’s attempt to defend against stress. This rise and fall in the data illustrate that NPQ measurements are more dynamic and responsive to indicate the stress state of turfgrass species compared to Fv/Fm. In addition, the response occurred earlier for NPQ (at about 40 hours of stress for perennial ryegrass compared to Fv/Fm at about 100 hours of stress for perennial ryegrass), which indicates earlier stress detection of this parameter.
In conclusion, the results indicate that future turfgrass trials and research studies would benefit from evaluating NPQ parameters for an earlier and more detailed assessment of the response of turfgrass species to drought stress conditions.
Ongoing work to evaluate NPQ for other stress conditions is needed.
The research says
- Perennial ryegrass was more drought sensitive than Kentucky bluegrass plants and there were differences in drought responses among varieties within each species.
- NPQ parameters indicate more dynamic and earlier responses to stress compared to Fv/Fm measurements of leaf structures.
- The chlorophyll fluorescence measurements were efficient at detecting species and varietal level differences in drought stress response in both turfgrass species evaluated here.
Acknowledgments
The authors thank the USGA and the Michigan Turfgrass Foundation for funding and support for this project. The results and figures in this article were adapted from an article previously published by the authors: https://bit.ly/3NXhzPu
Literature cited
- Barrs, H., and P. Weatherley. 1962. A re-examination of the relative turgidity technique for estimating water deficits in leaves. Australian Journal of Biological Sciences 15:413-428 (https://doi.org/10.1071/BI9620413).
- Cruz, J.A., L.J. Savage, R. Zegarac, C.C. Hall, M. Satoh-Cruz, G.A. Davis, W.K. Kovac, J. Chen and D.M. Kramer. 2016. Dynamic environmental photosynthetic imaging reveals emergent phenotypes. Cell Systems 2:365-377 (https://doi.org/10.1016/j.cels.2016.06.001).
- Grieco, M., V. Roustan, G. Dermendjiev, S. Rantala, A. Jain, M. Leonardelli, K. Neumann, V. Berger, D. Engelmeier, G. Bachmann, I. Ebersberger, E.M. Aro, W. Weckwerth and M. Teige. 2020. Adjustment of photosynthetic activity to drought and fluctuating light in wheat. Plant Cell & Environment 43(6):1484-1500 (https://doi.org/10.1111/pce.13756).
- Huang, B., and H. Gao. 1999. Physiological responses of diverse tall fescue cultivars to drought stress. HortScience 34(5):897-901 (https://doi.org/10.21273/HORTSCI.34.5.897).
- Wang, Z., B. Huang and Q. Xu. 2003. Effects of abscisic acid on drought responses of Kentucky bluegrass. Journal of the American Society for Horticultural Science 128(1): 36-41 (https://doi.org/10.21273/JASHS.128.1.0036).
Michael Itam is a research associate, David Hall is a graduate student, and Emily Merewitz (merewitz@msu.edu) is an associate professor, all in the Department of Plant, Soil and Microbial Sciences at Michigan State University, East Lansing.