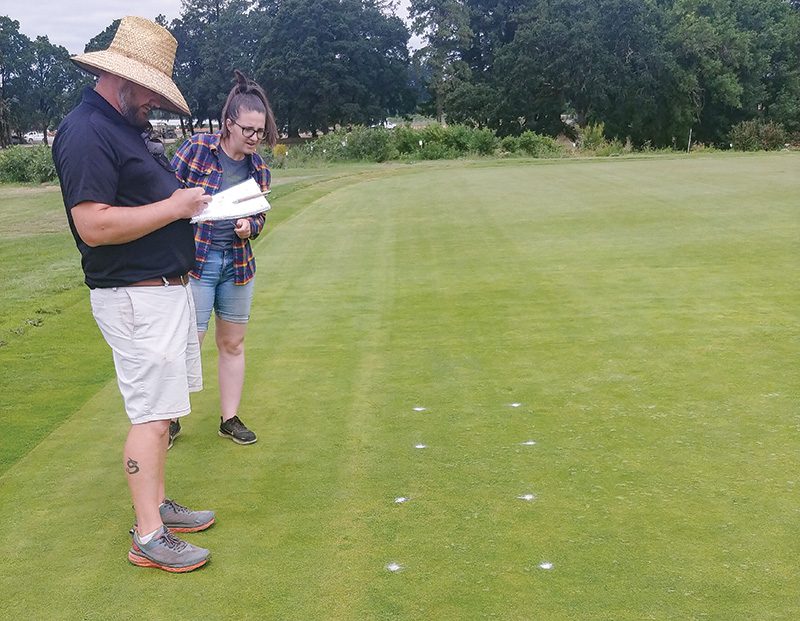
Figure 1. Visual assessment of percent anthracnose of a research putting green at Oregon State University in Corvallis. Photos by Alec Kowalewski
Methods used to assess turfgrass, weed and disease cover have transitioned from visual qualitative to quantitative measurements. Tools and methods used to produce these quantitative data include the point intercept method, digital image analysis, spectral
reflectance and unmanned aerial vehicles. The data collected using these methods has correlated well with the traditional visual measurements and sets the stage for an exciting future in turfgrass research.
Qualitative data
The three primary benefits of turfgrass are function, recreation and aesthetics (1). Functional components include reduced runoff, decreasing the heat island effect in an urban environment and carbon sequestration. Turfgrass is also the only plant system
that can be used repeatedly for recreational events that generate foot traffic, such as sports and social gatherings. Finally, turfgrass has an aesthetic appeal that increases property value. Considering this aesthetic appeal, it is no surprise that
turfgrass has long been assessed using visual parameters. Qualitative visual data, including turfgrass quality, color and living ground cover, have been standardized by the National Turfgrass Evaluation Program (Figure 1) (10). A pitfall of qualitative
or visual measurements is that they can vary substantially from person to person. This presents difficulty when trying to compare data collected by multiple people. While these visual ratings have significant worth, particularly when presenting findings
to golf course superintendents and other turfgrass managers, turfgrass scientists are continually searching for methods to assess turfgrass parameters quantitatively and reduce rater bias.
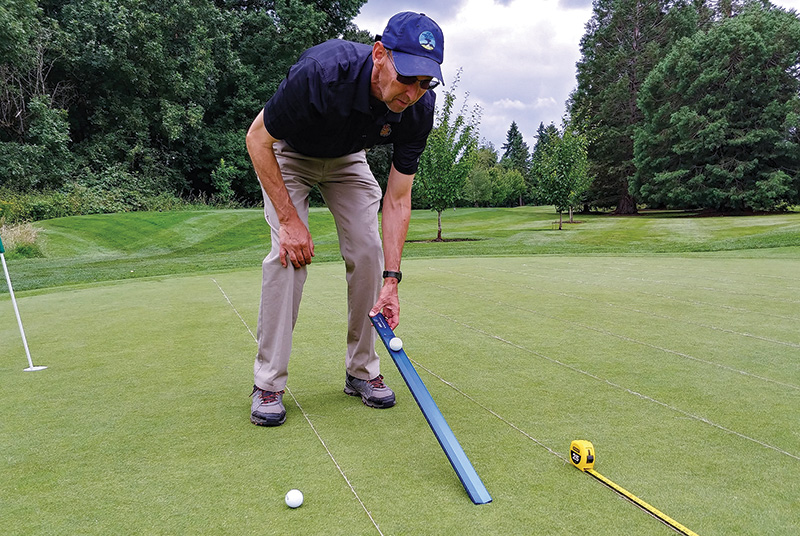
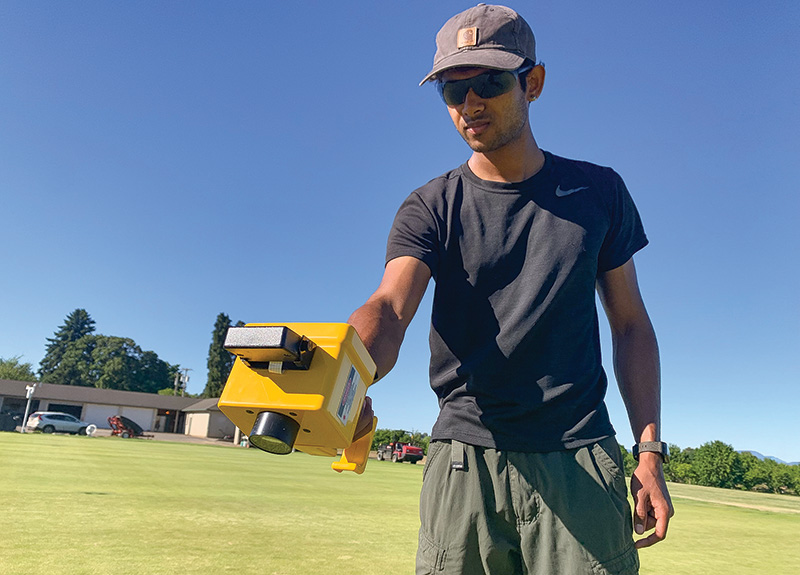
Figure 2. A Stimpmeter being used to quantitatively evaluate green speed at Royal Oaks Country Club in Vancouver, Wash., (top) and an NDVI meter being used to measure normalized difference vegetation index at Oregon State University in Corvallis (bottom).
Quantitative data
Quantitative response variables are assessed using numeric measurements. Examples in turfgrass management include green speed, saturated hydraulic conductivity and normalized difference vegetation index (NDVI) (Figure 2) (6, 12). Quantitative measurements
such as these are collected using tools, like a Stimpmeter, double ring infiltrometer or NDVI meter, respectively, which remove rater bias and produce data that is comparable across multiple researchers. There has been significant interest in developing
quantitative methods to assess turfgrass cover, particularly when assessing parameters like weed population and disease activity. Two methods used to assess turfgrass cover quantitatively are the point intercept method and digital image analysis.
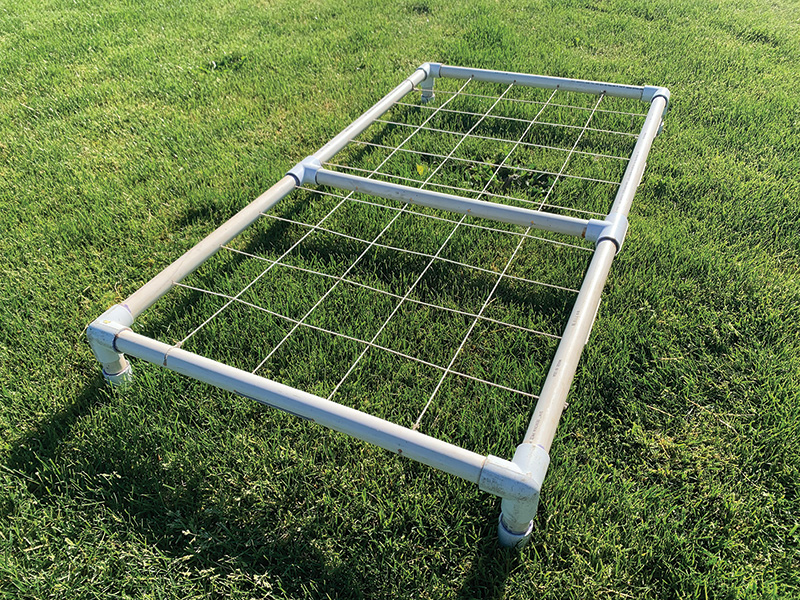
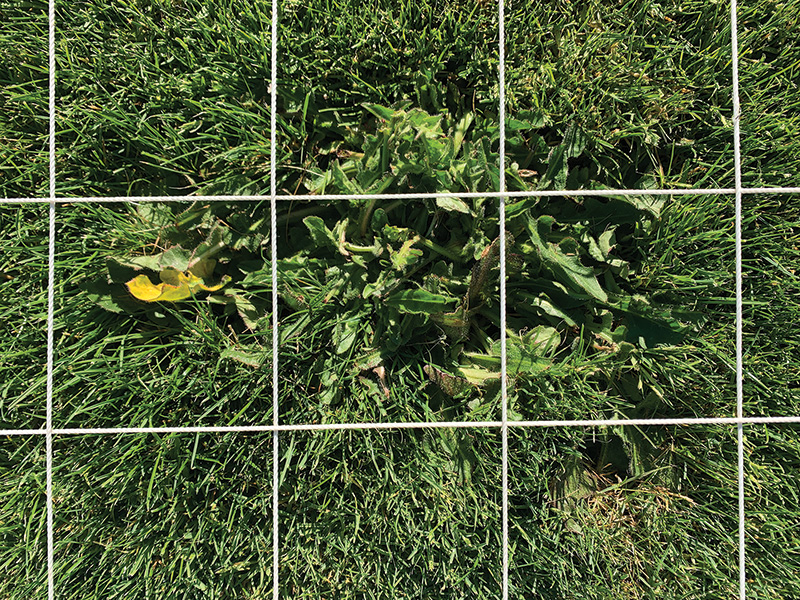
Figure 3. A frame with a 4-inch-by-4-inch string grid being used to assess percent turfgrass cover and broadleaf weed cover at Oregon State University, Corvallis
Point intercept method
The point intercept method has classically been used in plant ecology and more recently has been adapted for use in turfgrass research to measure percent turfgrass, weed and disease cover (5). An example of a point intercept method tool utilized in turfgrass
is a frame with a string grid (Figure 3). When using this method, the researcher can look down over the grid and count the number of transect points occupied by turfgrass or weeds, or turfgrass with or without disease symptoms. When using the frame
with string point intercept method, a pin can also be inserted into the turfgrass at the transect point to provide more accuracy. Another point intercept tool, the Forestry Suppliers Point Intercept Frame, includes a series of sliding pins mounted
on a frame with adjustable transect spacing (Figure 4).
Research conducted using the Forestry Suppliers Point Intercept Frame has determined that the closer the transect spacing, the less variable and more accurate the data (5). When statistically analyzing data, a high variability will likely reduce significant
differences, making it seem like the treatments are having little to no effect. Low variability, on the other hand, will improve the likelihood of statistical differences between treatments. However, even though closer intercept spacing reduces variability,
it also exponentially increases the time required to collect the data. For instance, research has determined that a 10.8-square-foot (1 square meter) transect with point intercept spacing at 4 inches by 4 inches (10.16 centimeters by 10.16 centimeters)
required 4 minutes to collect data but produced the largest variability. A 1-inch-by-1-inch (2.54-centimeter-by-2.54-centimeter) point intercept spacing across the same 10.8-square-foot transect, on the other hand, required 25 minutes to collect the
data and produced the lowest variability. A take home from this research was that when turf scientists are quantifying the surface area of pathogens with small infection centers, like anthracnose or dollar spot, or small weeds, like annual bluegrass,
a closer point intercept spacing is required to reduce variability in the data. However, if the assessment is of a pathogen with a large infection center, like summer patch or fairy ring, or large weeds, like dandelion, a larger point intercept spacing
likely could be used with minimal effect on data variability.
A final point intercept method includes the collection of digital images, which are then overlaid with a digital grid using a program like SigmaScan (Figure 5). After this, a person visually evaluates the image transect points to evaluate percent cover.
Like the adjustable transect spacing tool discussed above, when a digital grid with closer spacing is used, the variability in the data is decreased, but the time required to collect the data is increased.
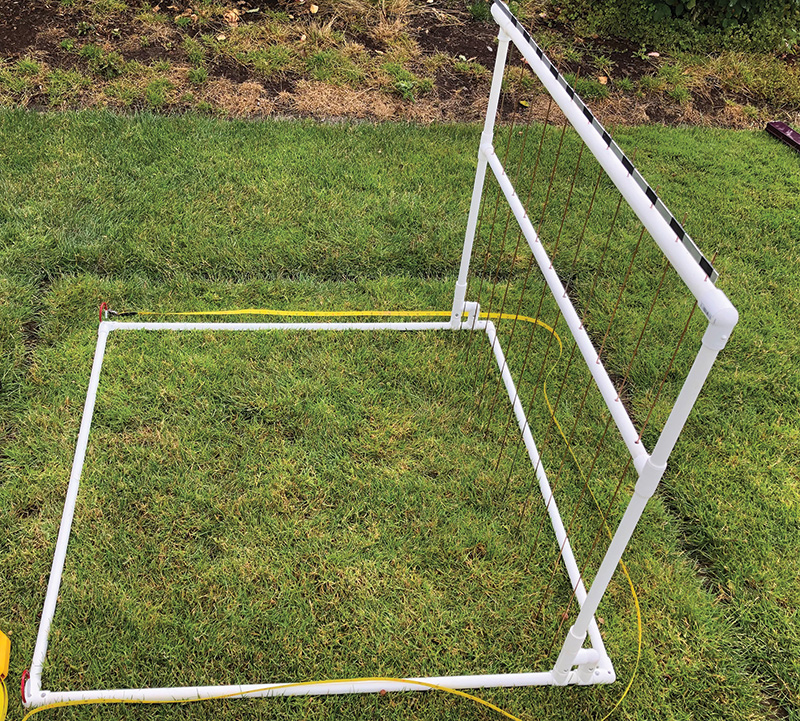
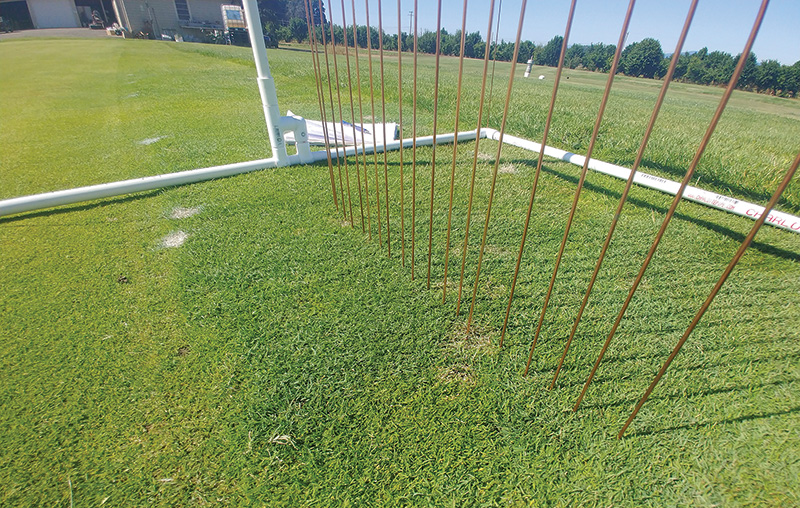
Figure 4. An adjustable frame with sliding pins being used to assess percent green cover of perennial ryegrass in a drought trial (top) and percent dollar spot of creeping bentgrass (bottom) at Oregon State University, Corvallis. Photos by Alyssa Cain and Alec Kowalewski
Digital image analysis
Digital image analysis in turfgrass science research was developed by Michael Richardson, Ph.D., and Doug Karcher, Ph.D., at the University of Arkansas in the early 2000s and was a breakthrough in quantitative assessment of turfgrass cover (4, 11). This
method typically includes the collection of images using a photo box with internal light, which allows for consistent lighting despite environmental conditions or time of day, and a digital camera. Software packages like SigmaScan or TurfAnalyzer
are then used to search and record the number of pixels within a given photo that meet a specific color or color tones. These data are then converted to various response variables, such as color, density, uniformity and cover. TurfAnalyzer is a free
online software package that is easily adjustable and can be used to assess percent turfgrass cover or lack of cover quantitively.
This methodology has been used successfully to quantify cool-season turfgrass establishment from seed, lateral growth of warm-season turf when planted as plugs or recovering from divots, and topdressing material remaining on the surface after application
(5, 11, 14, 15). Lack of cover has also been a successful method for assessing the percent cover of some turfgrass pathogens (Figure 6). Research has also determined that digital image analysis is a reliable method to quantify dollar spot (3), which
also correlates well to the point intercept method and visual percent cover ratings (5). Digital image analysis is a method for quantifying cover that is substantially quicker than the point intercept method, particularly if a macro code is used for
a batch analysis of large quantities of photos in a single event. However, research has also determined that digital image analysis was not effective at quantifying anthracnose, and the point intercept method is the preferred tool for quantitatively
assessing this pathogen’s percent cover (5). Research has also determined that green pigments and abiotic damage can interfere with digital image analysis, and in these instances the point intercept method can be used to provide quantitative
data (7, 8, 9).
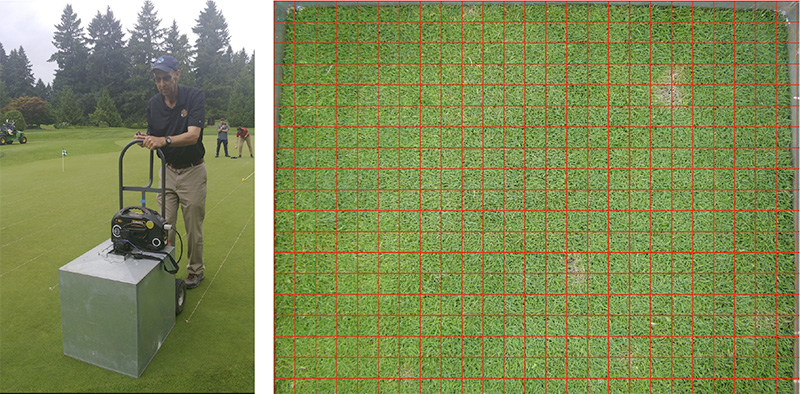
Figure 5. Digital images being collected using a photo box, with internal lighting and a digital camera at Royal Oaks Country Club in Vancouver, Wash. (left), and a 1-inch-by-1-inch digital grid laid over a digital image of creeping bentgrass with dollar spot infection centers at Oregon State University in Corvallis (right). Photos by Alec Kowalewski and Clint Mattox
Unmanned aerial vehicles
In recent years, digital images of turfgrass have been collected using unmanned aerial vehicles, or drones (2, 16). Drones can collect digital images across various wavelengths, such as visible light (red, green and blue) and near infrared light. This
presents the opportunity for digital image analysis, as well as calculation of NDVI values, which are an indicator of plant health. Normalized difference vegetation index is calculated using red and near infrared light (17) and has shown a strong
correlation to percent turfgrass cover in research conducted on cool-season and warm-season turfgrass. In addition to digital images and spectral reflectance, drones are also capable of capturing surface temperatures, which are used to produce a thermal
image. Data such as these have been collected from small-plot research and from golf courses. For instance, in a USDA National Institute of Food and Agriculture funded project titled “WinterTurf: A holistic approach to understanding the mechanisms
and mitigating the effects of winter stress on turfgrasses in northern climates,” unmanned aerial vehicles are being used to identify conditions that exacerbate winter kill in Oregon and Minnesota (Figure 7) (13). Preliminary findings from these
drone flyovers determined that extensive winter turf damage is often coupled with lasting snow cover, daytime temperatures that promote a cycle of freezing and thawing, and shade produced by trees and slopes. Unmanned aerial vehicles offer the ability
to further streamline the time required to collect digital images if global positioning is used to subdivide large images.
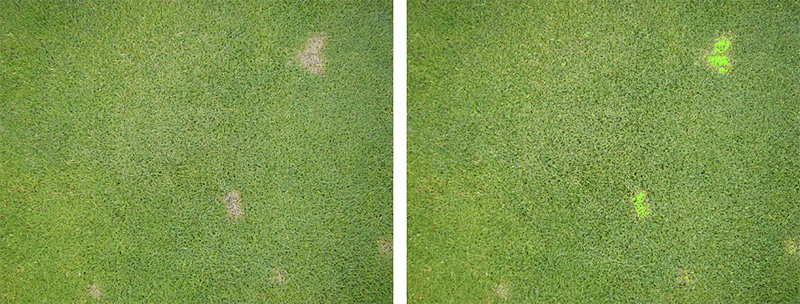
Figure 6. Image of dollar spot on creeping bentgrass collected using a photo box with internal light and a digital camera at Oregon State University in Corvallis (left), and percent dollar spot quantified using TurfAnalyzer (right). Photos by Alec Kowalewski
Conclusion
Research in the field of turfgrass management has made substantial strides from a dependency on visual data to a wide variety of quantitative data that is constantly being improved upon. While the point intercept method, digital image analysis and unmanned
aerial vehicles represent a significant change in turfgrass science, there is still a possibility to improve the efficiency of data collection and processing within these methods. It will be interesting to see where the next generation of turfgrass
scientists take this shift toward quantitative, digital data.
The research says
- When turf scientists are quantifying the surface area of pathogens with small infection centers, like anthracnose or dollar spot, or small weeds, like annual bluegrass, a closer point intercept spacing is required to reduce variability in the data.
- During assessment of a pathogen with a large infection center, like summer patch or fairy ring, or large weeds, like dandelion, a larger point intercept spacing could be used with minimal effect on data variability.
- Digital image analysis is a method for quantifying cover that is substantially quicker than the point intercept method, particularly if a macro code is used for a batch analysis of large quantities of photos in a single event; however, digital image
analysis is not effective at quantifying anthracnose, and the point intercept method is the preferred tool for quantitatively assessing this pathogen’s percent cover.
- Preliminary findings from a research project in Oregon and Minnesota using data gathered from drone flyovers determined that extensive winter turf damage is often coupled with lasting snow cover, daytime temperatures that promote a cycle of freezing
and thawing, and shade produced by trees and slopes.
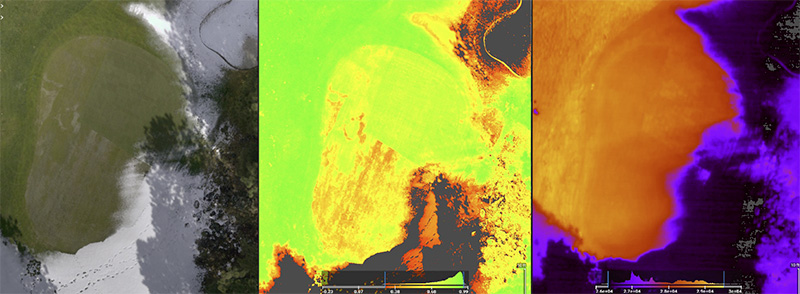
Figure 7. An unmanned aerial vehicle generated a normal view (left), normalized difference vegetation index image (middle) and thermal images (right) collected at the Black Butte Ranch in Sisters, Ore. Photos courtesy of Alec Kowalewski and Cole Stover
Funding
Information presented in this article was funded by the U.S. Department of Agriculture-National Institute of Food and Agriculture Specialty Crops Research Initiative Grants Program (award Nos. 2018-51181-28436 and 2021-51181-35861)
Literature cited
- Brosnan, J.T., A. Chandra, R.E. Gaussoin, A. Kowalewski, B. Leinauer, F.S. Rossi, et al. 2020. A justification for continued management of turfgrass during economic contraction. Agricultural & Environmental Letters 5(1):e20033 (https://doi.org/10.1002/ael2.20033).
- Hong, M., D.J. Bremer and D. van der Merwe. 2019. Using small unmanned aircraft systems for early detection of drought stress in turfgrass. Crop Science 59:2829-2844 (https://doi.org/10.2135/cropsci2019.04.0212).
- Horvath, B., and J. Vargas Jr. 2005. Analysis of dollar spot disease severity using digital image analysis. International Turfgrass Society Research Journal 10:196-201 (https://www.researchgate.net/publication/268359230_ANALYSIS_OF_DOLLAR_SPOT_DISEASE_SEVERITY_USING_DIGITAL_IMAGE_ANALYSIS).
- Karcher, D.E., and M.D. Richardson. 2003. Quantifying turfgrass color using digital image analysis. Crop Science 43:943−951 (https://doi.org/10.2135/cropsci2003.9430).
- Kowalewski, A.R., C.J. Schmid, E.T. Braithwaite, B.C. McNally, M.T. Elmore, C.M. Mattox, et al. 2023. Comparing methods to quantify cover in turfgrass research. Crop Science 63(3):1581-1591 (https://doi.org/10.1002/csc2.20908).
- Kowalewski, A., B. McDonald, C. Mattox, A. Cain, S. Tao and E. Braithwaite. 2021. Quantifying golf shoe effects on putting greens. Golf Course Management 89(10):65-68 (https://gcmonline.com/course/environment/news/golf-shoe-traffic-putting-greens).
- Mattox, C.M., A.R. Kowalewski, B.W. McDonald, J.G. Lambrinos and J.W. Pscheidt. 2020. Combinations of rolling, mineral oil, sulfur, and phosphorous acid affect Microdochium patch severity. Agronomy Journal 112(5):3383-3395 (https://doi.org/10.1002/agj2.20191).
- Mattox, C.M., A.R. Kowalewski, B.W. McDonald, J.G. Lambrinos, B.L. Daviscourt and J.W. Pscheidt. 2017. Nitrogen and iron sulfate affect Microdochium patch severity and turf quality on annual bluegrass putting greens. Crop Science 57(S1):S-293-S-300
(https://doi.org/10.2135/cropsci2016.02.0123).
- Mattox, C., A. Kowalewski and B. McDonald. 2019. The effects of iron sulfate heptahydrate water carrier volumes on Microdochium patch suppression and turfgrass quality. Agronomy Journal 112(5):3363-3370 (https://doi.org/10.1002/agj2.20133).
- Morris, K.N., and R.C. Shearman. 1998. NTEP Turfgrass Evaluation Guidelines. National Turfgrass Evaluation Program. Pages 1-5.
- Richardson, M.D., D.E. Karcher and L.C. Purcell. 2001. Quantifying turfgrass cover using digital image analysis. Crop Science 41(6):1884-1888 (https://doi.org/10.2135/cropsci2001.1884).
- Schmid, C.J., R.E. Gaussoin, R.C. Shearman, M. Mamo and C.S. Wortmann. 2014. Cultivation effects on organic matter concentration and infiltration rates of two creeping bentgrass (Agrostis stolonifera L.) putting greens. Applied Turfgrass Science 11(1):1-7
(https://doi.org/10.2134/ATS-2014-0032-RS).
- Stover, C. 2023. Unmanned aerial vehicle-based sensing: an update from Oregon. University of Minnesota Winter Turf Blog (https://winterturf.umn.edu/unmanned-aerial-vehicle-based-sensing-update-oregon).
- Wang R., J.W. Hempfling, B.B. Clarke and J.A. Murphy. 2018. Seasonal and annual topdressing effects on anthracnose of annual bluegrass. Agronomy Journal 110(6):2130-2135 (https://doi.org/10.2134/agronj2018.01.0052).
- Williams, B.T., J.K. Kruse, J.B. Unruh and J.B. Sartain. 2011. An enhanced method of tracking divot recovery in turfgrass. Crop Science 51(5):2194-2198 (https://doi.org/10.2135/cropsci2010.11.0647).
- Zhang, J., S. Virk, W. Porter, K. Kenworthy, D. Sullivan and B. Schwartz. 2019. Applications of unmanned aerial vehicle based imagery in turfgrass field trials. Frontiers in Plant Science 10:1-12 (https://doi.org/10.3389/fpls.2019.00279).
- Zhang, J., D. Sullivan, A. Kowalewski, J. Peake, W. Anderson, F.C. Waltz and B. Schwartz. 2017. Evaluating hybrid bermudagrass using spectral reflectance under different mowing heights and trinexapac-ethyl applications. HortTechnology 27(1):45-53
(https://doi.org/10.21273/HORTTECH03436-16).
Alec Kowalewski, Ph.D., (Alec.Kowalewski@oregonstate.edu) is an associate professor and turfgrass specialist; Chas Schmid is a research associate; and Cole Stover is a student, all in the Department of Horticulture at Oregon State University, Corvallis;
and Clint Mattox, Ph.D., is a weed scientist at the USDA-Agricultural Research Service Forage Seed and Cereal Research Unit, Corvallis, Ore.