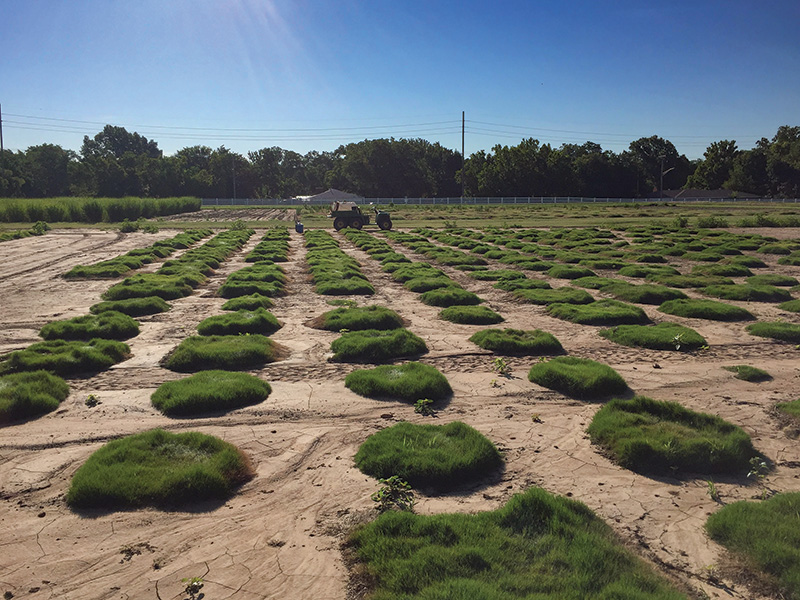
A mapping population of 109 first-generation self-pollinated progeny of the African bermudagrass genotype OKC1163 was established in a field nursery on the Oklahoma State University Agronomy Farm in Stillwater, Okla. Photo by Shuhao Yu
African bermudagrass originated in South Africa (2). It is used for crosses with common bermudagrasses to produce fine-textured, high-quality, interspecific hybrid turfgrass cultivars that are frequently used across tropical, subtropical and transitional
climates around the world (7). Latitude 36, NorthBridge, Tifway, Tahoma 31, TifTuf and IronCutter are popular cultivars derived from crosses between African and common bermudagrass.
Bermudagrasses are susceptible to low-temperature winterkill when grown in the transitional climatic zone of the U.S., particularly in areas north of 36 degrees north (8). Winterkill typically results in unsightly and poor visual and functional quality
as well as reduced facility use leading to lower revenue and high facility repair costs. Kenworthy et al. (5) reported the inheritability (termed heritability) of spring green-up in African bermudagrass was high, meaning that parents will usually
pass on this trait to their offspring, and genetic improvement for winter survivability is possible. Ideally, any new grasses bred for winter survivability would also possess good drought resistance, due to the increasing risk of water scarcity challenging
the turfgrass industry. To identify drought-resistant genotypes, turfgrass breeders often evaluate turf canopy response to dry soil conditions using visual ratings such as leaf firing (LF). However, variations in drought response traits are not widely
reported for African bermudagrass, while the interaction between genetic drivers of winter survivability and LF is not understood.
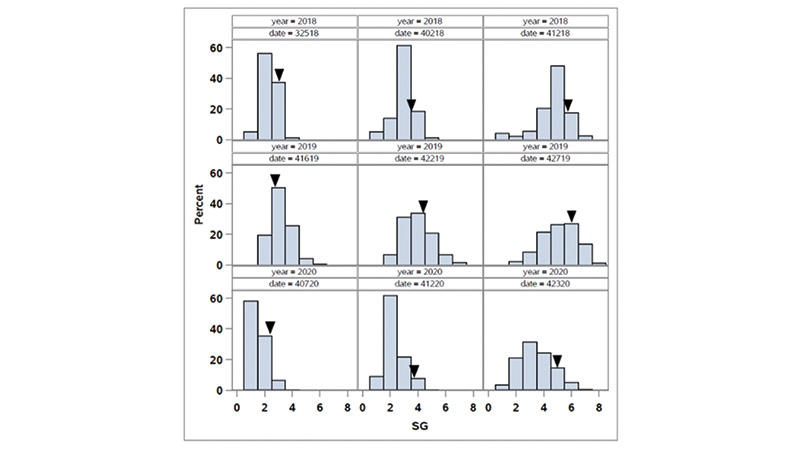
Figure 1. Distribution of spring green-up (SG) in the OKC1163 S1 bermudagrass population evaluated from 2018 to 2020. Solid triangles indicate OKC1163 means.
A linkage map contains genomic information of the relative position of molecular markers or known genes based on the calculated recombination frequency. Quantitative trait loci (QTL) analysis has been used as a primary method to bridge the connection
between DNA regions and visually observable characteristics (phenotype) associated with desired target performance traits. Previous studies have shown that freeze tolerance, a major contributor to winter survivability, is a complex quantitative (control
by multiple genes) trait. In the last decade, one study reported genomic information of African bermudagrass regarding establishment rate (10). However, no QTL associated with winter survivability or drought resistance has been reported for African
bermudagrass. Recently, a high-density African bermudagrass linkage map was published (10). This map provides a solid foundation for mapping QTL for winter survivability traits and LF. Accordingly, the objectives of the present study were to quantify
the genetic variability and identify the genomic regions associated with winter survivability traits and drought resistance in African bermudagrass.

Figure 2. Distribution of spring green-up percent green cover (SGPGC) in the OKC1163 S1 bermudagrass population evaluated from 2018 to 2020. Solid triangles indicate OKC1163 means.
Materials and methods
To assess winter survivability and drought resistance in the field, a mapping population composed of 109 first-generation self-pollinated progeny of the African bermudagrass genotype OKC1163 were transplanted to a field nursery on the Oklahoma State University
Agronomy Farm in Stillwater, Okla., on June 20, 2017. Experimental line OKC1163 was chosen, as it had previously been shown to have good winter survivability and a low evapotranspiration rate under nonlimiting soil moisture conditions (1, 6). The
experimental design was a randomized complete block with three replications. Plots were 3 feet by 3 feet (1 meter by 1 meter) with a 1-foot-wide (30.5-centimeter-wide) alley between neighboring plots. Plots received 2 pounds nitrogen per 1,000 square
feet (98 kilograms nitrogen per hectare) per year from 2017 to 2021. Weeds were controlled using Ronstar 2G (oxadiazon; Quali-Pro) preemergent herbicide and frequent hand weeding. Adequate irrigation was applied to prevent drought stress in 2017 during
the establishment phase. No supplemental irrigation was applied thereafter except in late August and early September of 2020 to facilitate recovery from drought stress injuries. Plots were mowed at 1.5 inches (3.8 centimeters) to reach a uniform growth
before the onset of seasonal drought conditions. To prevent further injury, plots were not mowed during summer drought. In mid-to-late August 2019 and 2020, the trial was mowed at 1.5 inches to remove the wilted canopy and facilitate recovery.
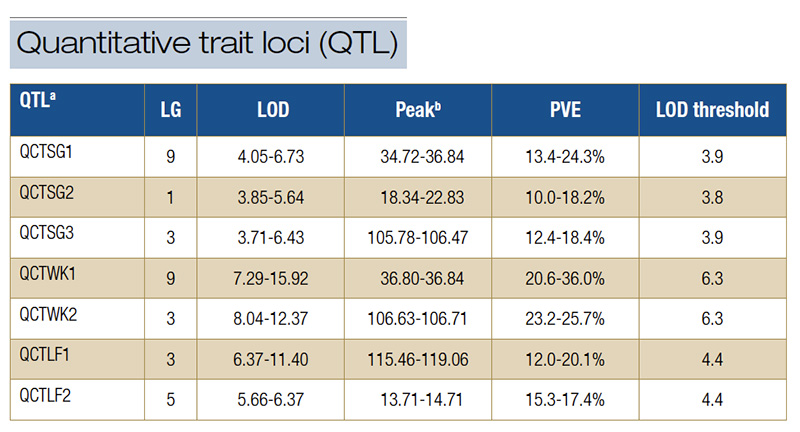
Table 1. Quantitative trait loci for spring green-up, spring green-up percent green cover, winterkiill and leaf firing were detected in the S1 population of OKC1163 African bermudagrass. aSG, spring green-up; SGPGC, spring green-up percent green cover; WK, winterkill; LF, leaf firing; QTL, quantitative trait loci; LG, linkage group; LOD, logarithm of the odds; PVE, phenotypic variation explained. bPeak is the position of the highest LOD value of QTL on the linkage group.
Spring green-up (SG) visual ratings as well as digital images were collected in early spring from 2018 to 2020. For the SG visual rating, 1 represented no green-up, and 9 represented complete green-up. Images were analyzed using the Turf Analyzer V1.01
software application to calculate the spring green-up percent green cover (SGPGC). Winterkill (WK) visual ratings were taken in mid-May of each year from 2018 to 2020. This rating represented the percentage of ground coverage killed by the low temperatures
in winter. In 2021, WK was calculated as the percentage of nongreen pixels using the Canopeo smartphone application.
In 2018, no leaf firing was observed. Moderate to severe drought symptoms were observed in some genotypes in 2019 and 2020. In 2019, LF visual ratings were taken on Aug. 6, when the water deficit was 5.9 inches (15 centimeters) warm-season grass evaportranspiration
calculated by the local Mesonet network weather station. In 2020, LF ratings were taken on Aug. 26, when the water deficit was 3.1 inches (7.9 centimeters) over the prior 60 days. A scale of 1-9 was used to quantify LF, where 1 represented completely
straw-colored leaves, and 9 represented completely green leaves. Irrigation was given periodically to allow plants to recover from drought injury.
The broad-sense heritability (H) for WK and LF was estimated using the following formula: H = VG/VP, where VG is the genetic variance and VP is the total phenotypical variance (3). All variance components were estimated using SAS V9.4 software. The detailed
information of the African bermudagrass linkage map used in this QTL mapping study was reported by Yu et al. (10). Best linear unbiased estimates (BLUEs) (more accurate compared to using arithmetic mean of three replications) of each trait was used
for QTL analyses via MapQTL 6.0 software (9).
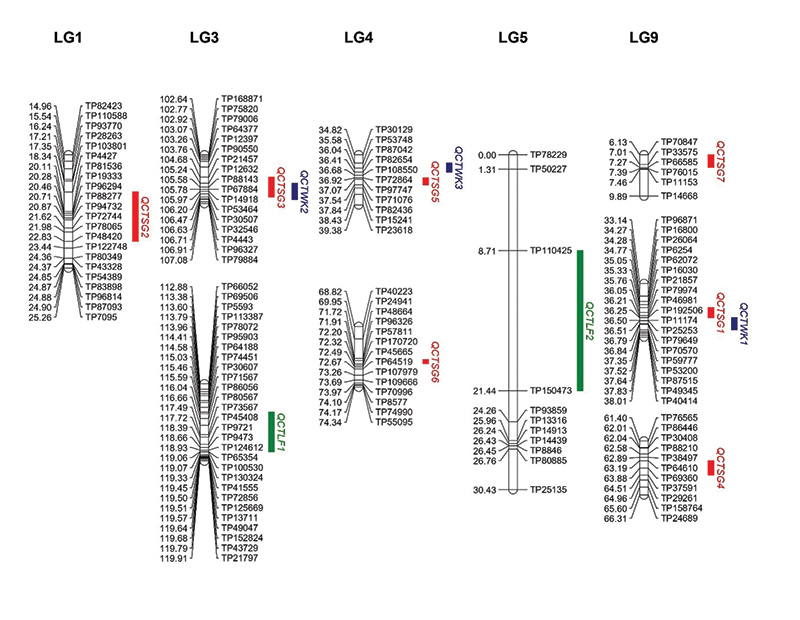
Figure 3. The locations of quantitative trait loci (QTL) peaks for spring green-up (SG), winterkill (WK) and leaf firing (LF) on the segments of OKC1163 linkage groups (LGs) 1, 3, 4, 5 and 9 generated from 1,278 markers mapped in 109 S1 bermudagrass progeny. Genetic distances (centiMorgans, cM) are listed on the left of each LG and corresponding markers are listed on the right. Red: QTL for SG; blue: QTL for WK; green: QTL for LF.
Results
The distributions of spring green-up and spring green-up percent green cover in the African bermudagrass population are given in Figures 1 and 2. The broad-sense heritability (the proportion of phenotypic variance attribute to genetic factor) for SG and
SGPGC was 0.36 and 0.42, respectively. Seven quantitative trait loci for SG and SGPGC were identified. Three QTL (QCTSG1, QCTSG2 and QCTSG3) were identified from at least two environments. Therefore, they were considered as consistent QTL (Table 1,
Figure 3). QCTSG1, located between 34.27 and 36.84 centiMorgan (cM; centiMorgan is a unit of measure for the frequency of genetic recombination) on LG9, was consistently detected in three years, explaining 11.2%-24.3% of the total phenotypic variation.
QCTSG2, detected in 2018 and 2019, was located in the region from 18.34-22.83 cM on LG1, accounting for 10.0%-18.2% of the total phenotypic variation. QCTSG3 was detected in 2019 and 2020 and located between 105.24 and 106.47 cM on LG4, explaining
up to 18.4% total phenotypic variation.
The distributions of winterkill in the African bermudagrass population are given in Figure 4. The broad-sense heritability for WK was 0.54. Three QTL associated with WK were identified, and QCTWK1 and QCTWK2 were consistent QTL (Table 1, Figure 3). QCTWK1
on LG9 between 34.27 and 36.84 cM accounted for 20.6%-36.0% of the total phenotypic variation from 2018 to 2020. QCTWK2 was detected in 2018 and 2019 and located on LG3 between 106.63 and 106.71 cM, accounting for 23.2%-25.7% of the total phenotypic
variation.
The distributions of leaf firing in the African bermudagrass population are given in Figure 5. The broad-sense heritability for LF was 0.80. Two consistent QTL were identified for LF (Table 1, Figure 3). QCTLF1 was located on LG3 at 115.45 and 119.06
cM, accounting for 20.1% and 32.4% of the total phenotypic variation in 2019 and 2020, respectively. The peaks of QCTLF2 were located on LG5 at position 13.71 cM in 2019 and 14.71 cM in 2020, accounting for 15.3% and 17.4% of the total phenotypic
variation, respectively.
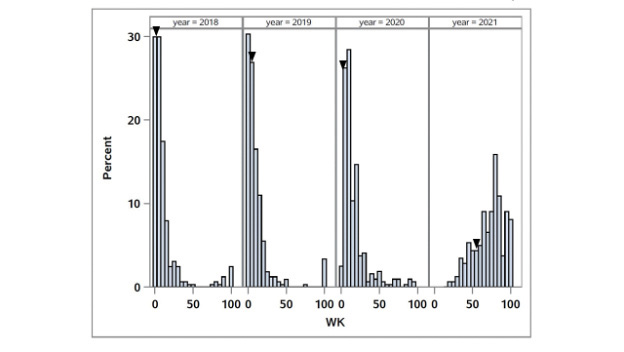
Figure 4. Distribution of winterkill (WK) in the OKC1163 S1 bermudagrass population evaluated from 2018 to 2020. Solid triangles indicate OKC1163 means.
Discussion
In this study, we estimated heritability and reported the QTL associated with winter survivability traits and LF in African bermudagrass. Moderate heritability was found for winter survivability traits, indicating that environments could influence their
phenotypic expression in African bermudagrass. However, the high heritability for LF suggests that it is less influenced by environments, and breeders can capture this variation more easily. A total of 10 QTL associated with winter survivability traits
was identified, and six of them were at least detected in two years. QCTSG1 and QCTWK1 were identified in three years, suggesting that these QTL consistently contributed to winter survival in African bermudagrass. Three QTL — QCTSG2, QCTSG3
and QCTWK2 — were identified in two years, suggesting that these QTL contributed to winter survival in African bermudagrass, but their expressions may have been affected by environments. The remaining QTL were only detected in a single year,
suggesting these QTL interacted with the specific environment in each year. However, in the present study, only two QTL were consistently detected for LF in 2019 and 2020. Being consistent with the high LF heritability estimates, the consistent QTL
suggest that these genomic regions were reliably associated with LF. The major LF QTL, QCTLF1, was located at the distal region of LG3. African bermudagrass LG3 is largely syntenic to rice chromosome one (unpublished data). Rice chromosome one carries
QTL involved in several traits, like rooting depth, deep root weight, total root dry weight and osmotic adjustment (4).
There were two genomic regions associated with consistent QTL identified for both SG and WK. The co-localization between QCTSG1 and QCTWK1 on LG9 and between QCTSG3 and QCTWK2 on LG3 indicated they were reliable regions and could be promising for developing
molecular markers in accelerating the selection process of breeding winter-hardy bermudagrass cultivars.
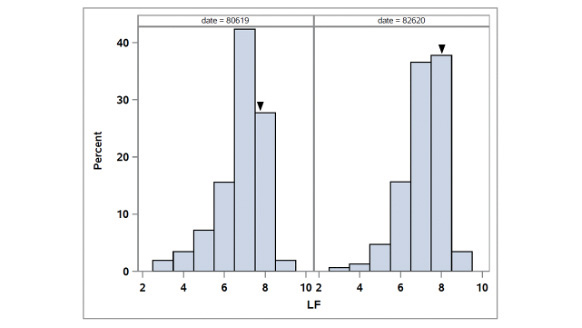
Figure 5. Distribution of leaf firing (LF) in the OKC1163 S1 bermudagrass population evaluated from 2019 to 2020. Solid triangles indicate OKC1163 means.
Acknowledgments
This work was funded in part by the U.S. Department of Agriculture Specialty Crop Research Initiative 2015-51181-24291 and 2019-1455-05/2019-51181-30472, Oklahoma Turf Research Foundation and Oklahoma Agricultural Experiment Station. Support for Amanda
Hulse-Kemp was provided by the U.S. Department of Agriculture Agricultural Research Service (USDA ARS) project number 6066-21310-005-00D. We would like to thank Pu Feng and Bradley Battershell for their assistance in the greenhouse and in the field,
respectively.
The Research Says:
- Moderate heritability was found for winter survivability traits, and high heritability was found for leaf firing.
- This study discovered 10 quantitative trait loci associated with winter survivability traits and two QTL for leaf firing in African bermudagrass. Eight of these QTL were consistent across at least two years.
- Two consistent QTL regions of overlap between spring green-up and winterkill QTL were identified. These QTL regions can be used in developing molecular markers associated with winter survivability traits.
- Elite African bermudagrass can be used as breeding materials to develop winter hardiness and drought-resistant interspecific hybrid bermudagrass.
Literature cited
- Amgain, N.R., D.K. Harris, S.B. Thapa, D.L. Martin, Y.Q. Wu and J.Q. Moss. 2018. Evapotranspiration rates of turf bermudagrasses under nonlimiting soil moisture conditions in Oklahoma. Crop Science 58(3):1409–1415 (https://doi.org/10.2135/cropsci
2017.08.0493).
- Harlan, J.R., J.M.J. de Wet and K.M. Rawal. 1970a. Geographic distribution of the species of Cynodon L.C. Rich (Gramineae). East African Agricultural Forestry Journal 36(2):220–226 (https://doi.org/10.1080/00128325.1970.11662465).
- Hallauer, A.R. 1970. Genetic variability for yield after four cycles of reciprocal recurrent selections in maize. Crop Science 10(5):482–485 (https://doi.org/10.2135/cropsci1970.0011183X001000050007x).
- Kamoshita, A., R.C. Babu, N.M. Boopathi and S. Fukai. 2008. Phenotypic and genotypic analysis of drought-resistance traits for development of rice cultivars adapted to rainfed environments. Field Crop Research 109(1-3):1–23 (https://doi.org/10.1016/j.fcr.2008.06.010).
- Kenworthy, K.E., C.M. Taliaferro, B.F. Carver, D.L. Martin, J.A. Anderson and G.E. Bell. 2006. Genetic variation in Cynodon transsvaalensis Burtt-Davy. Crop Science 46(6):2376–2381 (https://doi.org/10.2135/cropsci2006.02.0075).
- National Turfgrass Evaluation Program (NTEP). 2017. Final Report NTEP No. 18-14. 2013 National Bermudagrass Test. Retrieved from http://www.ntep.org/reports/bg13/bg13_18-14f/bg13_18-14f.htm.
- Taliaferro, C.M. 1992. Out of Africa — a new look at “African” bermudagrass. USGA Green Section Record July/August:10-12.
- Taliaferro, C.M., F.M. Rouquette Jr. and P. Mislevy. 2004. Bermudagrass and stargrass. Pages 417-475. In Moser, L.E. et al., eds. Warm-season (C4) grasses. ASA Monographs 45. ASA, CSSA and SSSA, Madison, Wis.
- Van Ooijen, J.W. 2006. MapQTL 6: Software for the mapping of quantitative trait loci in experimental populations of diploid species. Kyazma B.V., Wageningen, the Netherlands
- Yu, S., T. Fang, H. Dong, L. Yan, D.L. Martin, J.Q. Moss, C.H. Fontanier, Y.Q. Wu. 2021. Genetic and QTL mapping in African bermudagrass. The Plant Genome 14(1):e20073 (https://doi.org/10.1002/tpg2.20073).
Shuhao Yu (shuhao.yu@okstate.edu) is a research assistant professor, Dennis L. Martin and Justin Q. Moss are professors, and Charles H. Fontanier is an associate professor, all in the Department of Horticulture and Landscape Architecture, Oklahoma State University; Liuling Yan and Yanqi Wu are regents professors in the Department of Plant and Soil Sciences, Oklahoma State University; Ashley N. Schoonmaker is a graduate research assistant in the Department of Plant and Soil Sciences, North Carolina State University; and Amanda M. Hulse-Kemp is a computational biologist at the USDA-Agricultural Research Service Genomics and Bioinformatics Research Unit.